

Industry
Reduce the Cost of Payments Acceptance in 2026
January 29, 2026
January 29, 2026

Grace Greenwood
Grace Greenwood
Grace Greenwood

Since launching Pagos four years ago, we’ve has ingested over 15 billion transaction events representing $1.2 trillion in commerce volume—half of which was ingested in 2025. Every ingested event fuels the AI data models we use to generate actionable insights and active monitoring for our customers and partners, so the more we ingest, the more we all learn.
Our biggest takeaway from this incredible 2025 data influx? While all merchants are stuck in a seemingly never-ending war against the rising cost of payments acceptance, most are actually fighting the wrong battles.
To get you on track, we’ve put together a 2026 cost-reduction playbook, informed by real data from billions of global transactions. We’ll break down where your money goes, how to monitor for cost fluctuations, and what you can do to move the needle.
Want the TL;DR on how to monitor and reduce costs? Jump ahead to your 2026 action plan →
2025 Cost Breakdown
Across all US Enterprise merchants in the Pagos network, here’s the actual payment cost breakdown by fee category for 2025:
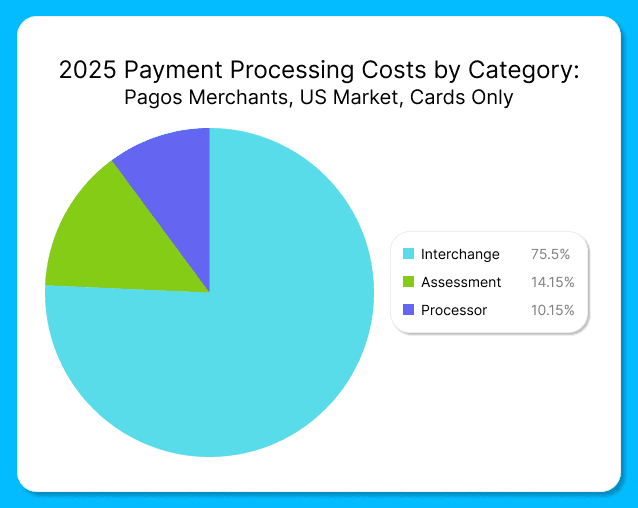
Interchange: 75.70% - Fees paid to card-issuing banks
Assessment Fees: 14.15% - Fees paid to card networks (Visa, Mastercard, etc.)
Processor Fees: 10.15% - Fees paid to your payment service providers (PSPs)
If 75% of your payment costs come from interchange fees, why do most cost-optimization business strategies focus on processing fees. It’s as if everyone is clipping coupons to save $10 on groceries, completely ignoring the exorbitant and ever-increasing rent on their luxury apartments.
We don’t say this to scare you, but to actually give you hope. Yes, accepting payments is expensive, but you have more leverage over the total cost than you may think! If Interchange is driving costs, it’s time to analyze how your processing behaviors are driving Interchange fees and penalties.
Interchange: Your Biggest Opportunity
Interchange is the money paid to issuing banks for providing cardholders with credit lines, servicing and points. When setting interchange rates, card networks take into account a variety of factors, including the card type and product used, transaction amount, merchant category code, local vs. cross-border, security flags (e.g. CVV, AVS, 3DS), and more. Given this level of complexity, it’s easy to hemorrhage money if you’re not taking active measures to manage interchange. Here’s how to fight back:
Missing Data Downgrades
Processing transactions without AVS or CVV data will always cost you more. Card networks charge higher interchange rates for transactions they perceive as riskier, and missing verification data screams "risk." Collect and pass this data with all customer-initiated transactions, and—i
f you’re vaulting payment credentials for subscriptions or recurring purchases—store it in your vault to pass alongside all merchant-initiated ones, as well. This single change can save you from downgrade fees that add up fast.
Authorization and Settlement Timing
Waiting too long to settle a transaction after receiving authorization will attract interchange downgrades. If you're batching or delaying settlement for operational reasons, you may want to consider if it’s really worth the downgrade costs.
Similarly, your authorization strategy can drive up interchange costs. If you're using partial or incremental authorizations, ensure you're following card network best practices. Authorizing for one amount and then settling for a substantially different amount can signal risk to the networks, and they price that risk accordingly. Review your authorization and settlement practices monthly to avoid any surprises.
The Retry Strategy Balancing Act
The right retry strategy increases revenue and customer retention while reducing loss and risk. That being said, balancing recovery potential with costs and penalties can be tricky. Not retrying enough means losing out on legitimate transactions, but aggressively retrying transactions on hard decline codes wastes processing dollars and can trigger network penalties.
Take action by analyzing your retry behavior in your payments data:
Identify which decline reasons actually convert on retry (e.g. insufficient_funds) vs those that never will (e.g. account_closed)
Tag retry attempts with custom metadata to track approval rates by retry attempt and identify common characteristics among unrecoverable transactions (e.g. card product, BIN, etc.)
Compare retry costs to conversion to determine if your efforts are paying off
Changing Enhanced Data Requirements
If you're a B2B merchant processing commercial cards, you’ve likely heard about Visa’s new Commercial Enhanced Data Program (CEDP). In short, Visa is replacing its legacy Level 2/Level 3 enhanced data programs and increasing interchange rates across the board. Learn more in a recent blog post we published on the topic titled Understanding Visa’s New CEDP Program: What You Need to Know.
Under the old system, merchants could qualify for lower rates with minimal or placeholder data. CEDP ends that, requiring merchants to consistently pass complete, accurate data to qualify for better rates. If you pass incomplete data, you'll pay higher interchange rates plus the 0.05% participation fee charged on every enhanced data transaction. If you process Visa commercial cards in the US, audit and improve your enhanced data flows now or go ahead and factor the rate increases into your 2026 cost baseline.
Tackling the Other Fee Categories
While Interchange is the primary cost driver for most businesses, we can’t ignore the cost-optimization opportunities available in the other two main categories: assessment and processor fees.
Assessments: A Penalty Minefield
Assessment fees paid to the card networks may seem immovable at first glance, but trust us when we say you’re not powerless here. Yes, you have to pay the non-negotiable base rates the card brands set. No, you don’t have to drown in penalties.
Card networks use penalties to incentivize good merchant behavior, including proper data handling, appropriate retry strategies, and network rule compliance. When you don’t follow the rules, you pay the price; if you or your processor release a code change that inadvertently has negative impacts on your payments operations, you’ll face higher penalties. We recommend monitoring your penalties as a percentage of total assessments month over month. This way, you can investigate any sudden changes or new penalties before they compound, and adjust your processing behaviors accordingly.
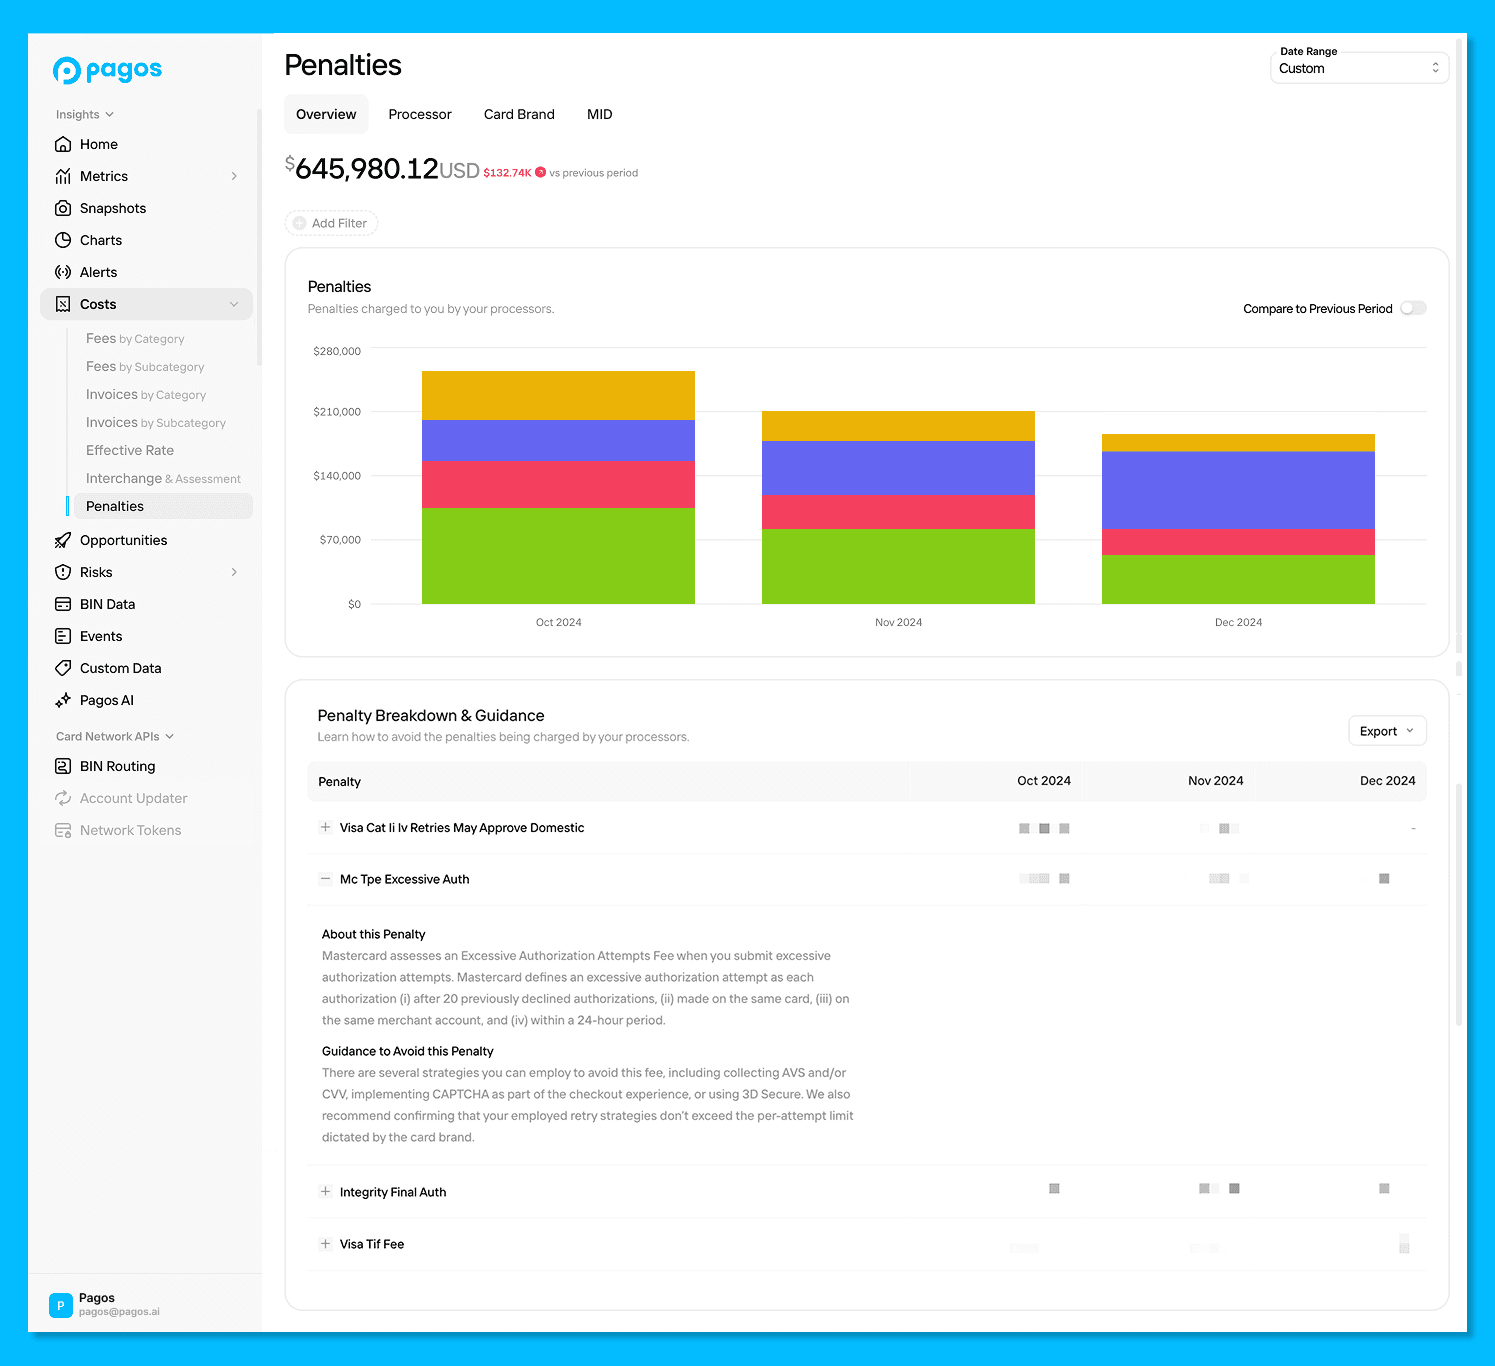
Pagos Insights Penalties Dashboard
Processing Fees: Value-Add or Cost-Add Services?
Processor fees may only represent 10% of your total costs, but this category can hide some significant issues. For example, the “value-added” services your PSPs offer (e.g. retry management, chargeback handling, fraud systems, etc.) might actually be unnecessarily driving up costs without providing tangible benefits, or—worse yet—hurting revenue if misconfigured.
Break your processor fees down by subcategory to track what you're paying for and how much; then calculate any authorization rate improvements, interchange savings, and churn reduction benefits. You may identify services you're paying for but not using, or instances where the service is actually hurting revenue (like fraud rules blocking legitimate transactions).
Keep in mind, some value-adds are definitely worth the money. Here's what typically delivers ROI:
Account Updater: Keeping card credentials current fights involuntary churn from expired or reissued cards. But here's the key: you don't need to update every card in your vault. Selectively update cards associated with active subscriptions or repeat purchasers, then track whether the service fees are justified by recovered revenue.
Network Tokenization: Replacing your stored PANs with network tokens can reduce interchange fees by up to 10 basis points per transaction while improving authorization rates and reducing fraud. For merchants with recurring revenue or stored credentials, this pays for itself quickly. The Network Tokenization Opportunities dashboard in Pagos Insights can actually help you quantify the potential savings associated with using network tokens! Learn more.
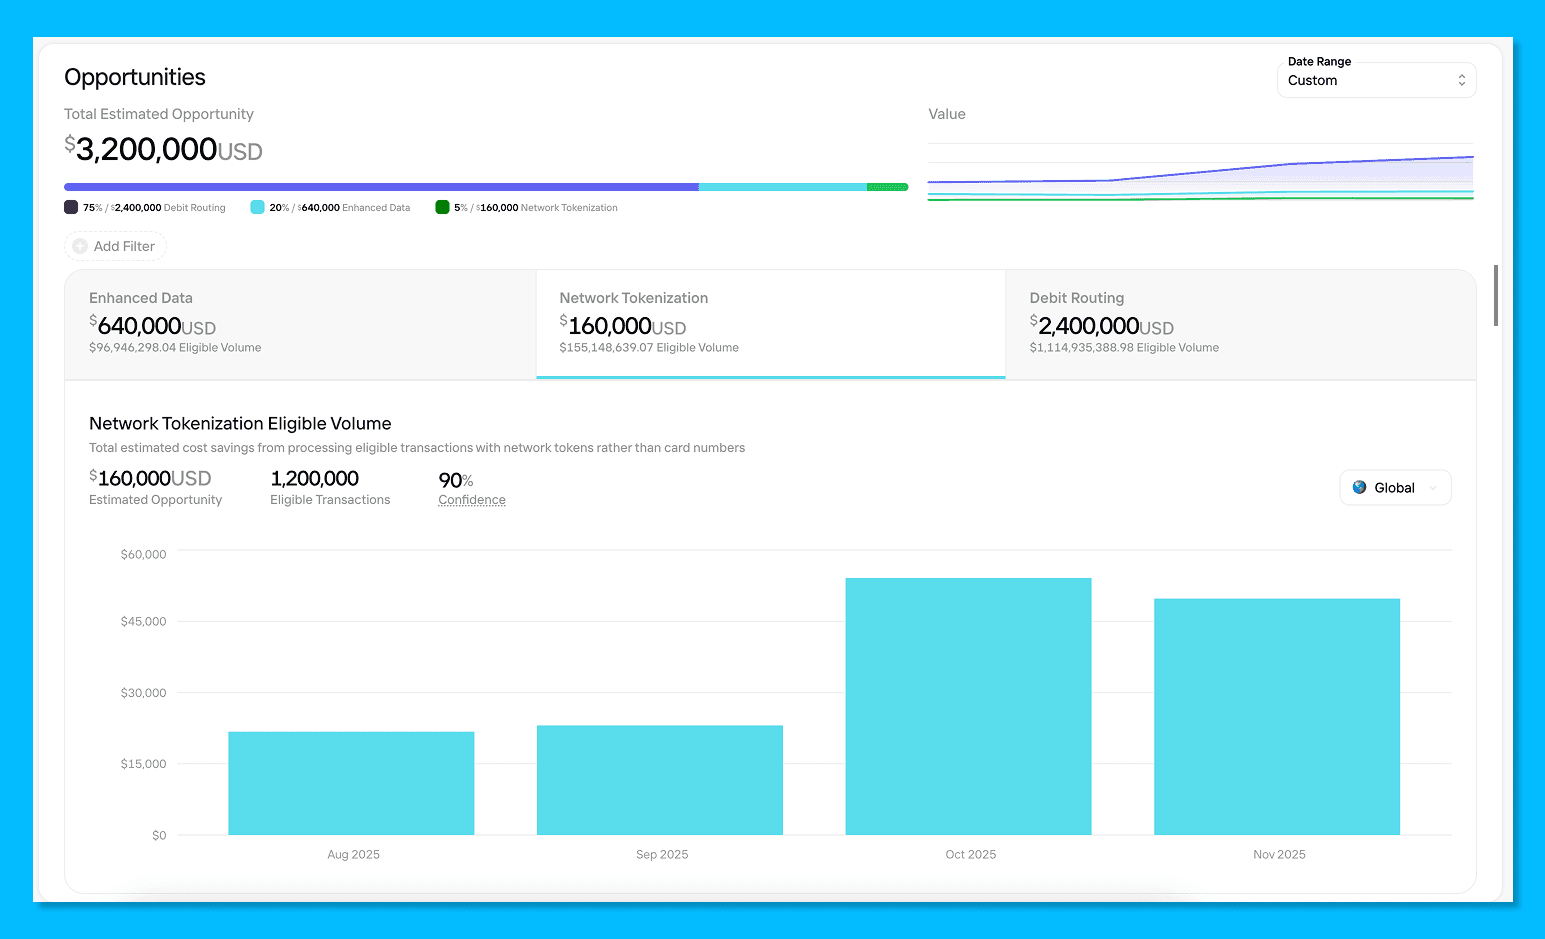
Pagos Insights Network Tokenization Opportunity
Ultimately, as your business scales, only you know what operational decisions and additional services can help you meet your optimization goals—not your PSPs. It’s up to you to speak up and take charge.
Your 2026 Monitoring Framework
If 2026 is the year you’re going to tackle payments costs, here's your monitoring checklist:
Monthly (at minimum):
Check your effective rate - Total fees divided by total sales, broken down by processor. This is your north star metric for establishing cost baselines.
Review a 3-month window - The current month is always incomplete (especially for card processing, where many fees aren't available until month-end). Look at the last three completed months to monitor trends.
Track penalty and downgrade percentages - Are these categories growing as a proportion of total costs? If yes, investigate immediately.
Monitor transaction count vs. processor fees - Processor fees typically scale with transaction volume. If fees are increasing faster than transaction count, you're paying for something new or getting charged more per transaction.
Quarterly:
Analyze card mix changes - Shifts in card type (credit vs. debit), card product (premium vs. standard), or payment method type directly impact interchange costs. If costs changed significantly, check if your card mix changed with it.
Compare processors - If you use multiple processors, compare their fees for the same card brand. Assuming similar underlying transaction types (geography, card mix), fees should be similar. Variation reveals routing opportunities.
When something changes:
Check network fee schedules - Card networks release bulletins with rate changes and new fees multiple times per year. New penalties or rate increases could explain cost jumps.
Review code deployments - Did you change how you process transactions? Did you or one of your partners (e.g. processor, payment orchestrator, or third-party tools) release a code change? Bugs and even small changes to data collection, settlement timing, or retry logic can impact costs.
What Actually Works: Start Here
If you're reading this and thinking "I don't even know my current effective rate by processor," start there. You can't optimize what you can't see, and Pagos can provide you real cost data visibility in Pagos Insights, our payments data optimization platform.
Your Week One action plan with Pagos Insights:
Establish your baseline - Visualize your effective rate for each processor, payment method, and currency you accept. This is your starting point.
Categorize your costs - Establish baselines for each cost category (e.g. Interchange, Assessment, and Processor) and subcategories (e.g. downgrades, penalties, value-added services).
Identify your biggest bucket - For most merchants, it's interchange. That's where you'll find the most opportunity.
Audit your data practices - Are you passing AVS and CVV with stored credentials? How's your settlement timing? What's your retry strategy?
Set up monthly monitoring - Don't wait for your annual planning cycle. Costs should be reviewed monthly with a 3-month baseline window.
Want to see exactly where your payment costs are going? Pagos Insights gives you real-time visibility into fees across all your processors, automatically categorized and ready to analyze. Explore how to use custom charts in Pagos Insights to analyze your cost data:
Since launching Pagos four years ago, we’ve has ingested over 15 billion transaction events representing $1.2 trillion in commerce volume—half of which was ingested in 2025. Every ingested event fuels the AI data models we use to generate actionable insights and active monitoring for our customers and partners, so the more we ingest, the more we all learn.
Our biggest takeaway from this incredible 2025 data influx? While all merchants are stuck in a seemingly never-ending war against the rising cost of payments acceptance, most are actually fighting the wrong battles.
To get you on track, we’ve put together a 2026 cost-reduction playbook, informed by real data from billions of global transactions. We’ll break down where your money goes, how to monitor for cost fluctuations, and what you can do to move the needle.
Want the TL;DR on how to monitor and reduce costs? Jump ahead to your 2026 action plan →
2025 Cost Breakdown
Across all US Enterprise merchants in the Pagos network, here’s the actual payment cost breakdown by fee category for 2025:
Interchange: 75.70% - Fees paid to card-issuing banks
Assessment Fees: 14.15% - Fees paid to card networks (Visa, Mastercard, etc.)
Processor Fees: 10.15% - Fees paid to your payment service providers (PSPs)
If 75% of your payment costs come from interchange fees, why do most cost-optimization business strategies focus on processing fees. It’s as if everyone is clipping coupons to save $10 on groceries, completely ignoring the exorbitant and ever-increasing rent on their luxury apartments.
We don’t say this to scare you, but to actually give you hope. Yes, accepting payments is expensive, but you have more leverage over the total cost than you may think! If Interchange is driving costs, it’s time to analyze how your processing behaviors are driving Interchange fees and penalties.
Interchange: Your Biggest Opportunity
Interchange is the money paid to issuing banks for providing cardholders with credit lines, servicing and points. When setting interchange rates, card networks take into account a variety of factors, including the card type and product used, transaction amount, merchant category code, local vs. cross-border, security flags (e.g. CVV, AVS, 3DS), and more. Given this level of complexity, it’s easy to hemorrhage money if you’re not taking active measures to manage interchange. Here’s how to fight back:
Missing Data Downgrades
Processing transactions without AVS or CVV data will always cost you more. Card networks charge higher interchange rates for transactions they perceive as riskier, and missing verification data screams "risk." Collect and pass this data with all customer-initiated transactions, and—i
f you’re vaulting payment credentials for subscriptions or recurring purchases—store it in your vault to pass alongside all merchant-initiated ones, as well. This single change can save you from downgrade fees that add up fast.
Authorization and Settlement Timing
Waiting too long to settle a transaction after receiving authorization will attract interchange downgrades. If you're batching or delaying settlement for operational reasons, you may want to consider if it’s really worth the downgrade costs.
Similarly, your authorization strategy can drive up interchange costs. If you're using partial or incremental authorizations, ensure you're following card network best practices. Authorizing for one amount and then settling for a substantially different amount can signal risk to the networks, and they price that risk accordingly. Review your authorization and settlement practices monthly to avoid any surprises.
The Retry Strategy Balancing Act
The right retry strategy increases revenue and customer retention while reducing loss and risk. That being said, balancing recovery potential with costs and penalties can be tricky. Not retrying enough means losing out on legitimate transactions, but aggressively retrying transactions on hard decline codes wastes processing dollars and can trigger network penalties.
Take action by analyzing your retry behavior in your payments data:
Identify which decline reasons actually convert on retry (e.g. insufficient_funds) vs those that never will (e.g. account_closed)
Tag retry attempts with custom metadata to track approval rates by retry attempt and identify common characteristics among unrecoverable transactions (e.g. card product, BIN, etc.)
Compare retry costs to conversion to determine if your efforts are paying off
Changing Enhanced Data Requirements
If you're a B2B merchant processing commercial cards, you’ve likely heard about Visa’s new Commercial Enhanced Data Program (CEDP). In short, Visa is replacing its legacy Level 2/Level 3 enhanced data programs and increasing interchange rates across the board. Learn more in a recent blog post we published on the topic titled Understanding Visa’s New CEDP Program: What You Need to Know.
Under the old system, merchants could qualify for lower rates with minimal or placeholder data. CEDP ends that, requiring merchants to consistently pass complete, accurate data to qualify for better rates. If you pass incomplete data, you'll pay higher interchange rates plus the 0.05% participation fee charged on every enhanced data transaction. If you process Visa commercial cards in the US, audit and improve your enhanced data flows now or go ahead and factor the rate increases into your 2026 cost baseline.
Tackling the Other Fee Categories
While Interchange is the primary cost driver for most businesses, we can’t ignore the cost-optimization opportunities available in the other two main categories: assessment and processor fees.
Assessments: A Penalty Minefield
Assessment fees paid to the card networks may seem immovable at first glance, but trust us when we say you’re not powerless here. Yes, you have to pay the non-negotiable base rates the card brands set. No, you don’t have to drown in penalties.
Card networks use penalties to incentivize good merchant behavior, including proper data handling, appropriate retry strategies, and network rule compliance. When you don’t follow the rules, you pay the price; if you or your processor release a code change that inadvertently has negative impacts on your payments operations, you’ll face higher penalties. We recommend monitoring your penalties as a percentage of total assessments month over month. This way, you can investigate any sudden changes or new penalties before they compound, and adjust your processing behaviors accordingly.
Pagos Insights Penalties Dashboard
Processing Fees: Value-Add or Cost-Add Services?
Processor fees may only represent 10% of your total costs, but this category can hide some significant issues. For example, the “value-added” services your PSPs offer (e.g. retry management, chargeback handling, fraud systems, etc.) might actually be unnecessarily driving up costs without providing tangible benefits, or—worse yet—hurting revenue if misconfigured.
Break your processor fees down by subcategory to track what you're paying for and how much; then calculate any authorization rate improvements, interchange savings, and churn reduction benefits. You may identify services you're paying for but not using, or instances where the service is actually hurting revenue (like fraud rules blocking legitimate transactions).
Keep in mind, some value-adds are definitely worth the money. Here's what typically delivers ROI:
Account Updater: Keeping card credentials current fights involuntary churn from expired or reissued cards. But here's the key: you don't need to update every card in your vault. Selectively update cards associated with active subscriptions or repeat purchasers, then track whether the service fees are justified by recovered revenue.
Network Tokenization: Replacing your stored PANs with network tokens can reduce interchange fees by up to 10 basis points per transaction while improving authorization rates and reducing fraud. For merchants with recurring revenue or stored credentials, this pays for itself quickly. The Network Tokenization Opportunities dashboard in Pagos Insights can actually help you quantify the potential savings associated with using network tokens! Learn more.
Pagos Insights Network Tokenization Opportunity
Ultimately, as your business scales, only you know what operational decisions and additional services can help you meet your optimization goals—not your PSPs. It’s up to you to speak up and take charge.
Your 2026 Monitoring Framework
If 2026 is the year you’re going to tackle payments costs, here's your monitoring checklist:
Monthly (at minimum):
Check your effective rate - Total fees divided by total sales, broken down by processor. This is your north star metric for establishing cost baselines.
Review a 3-month window - The current month is always incomplete (especially for card processing, where many fees aren't available until month-end). Look at the last three completed months to monitor trends.
Track penalty and downgrade percentages - Are these categories growing as a proportion of total costs? If yes, investigate immediately.
Monitor transaction count vs. processor fees - Processor fees typically scale with transaction volume. If fees are increasing faster than transaction count, you're paying for something new or getting charged more per transaction.
Quarterly:
Analyze card mix changes - Shifts in card type (credit vs. debit), card product (premium vs. standard), or payment method type directly impact interchange costs. If costs changed significantly, check if your card mix changed with it.
Compare processors - If you use multiple processors, compare their fees for the same card brand. Assuming similar underlying transaction types (geography, card mix), fees should be similar. Variation reveals routing opportunities.
When something changes:
Check network fee schedules - Card networks release bulletins with rate changes and new fees multiple times per year. New penalties or rate increases could explain cost jumps.
Review code deployments - Did you change how you process transactions? Did you or one of your partners (e.g. processor, payment orchestrator, or third-party tools) release a code change? Bugs and even small changes to data collection, settlement timing, or retry logic can impact costs.
What Actually Works: Start Here
If you're reading this and thinking "I don't even know my current effective rate by processor," start there. You can't optimize what you can't see, and Pagos can provide you real cost data visibility in Pagos Insights, our payments data optimization platform.
Your Week One action plan with Pagos Insights:
Establish your baseline - Visualize your effective rate for each processor, payment method, and currency you accept. This is your starting point.
Categorize your costs - Establish baselines for each cost category (e.g. Interchange, Assessment, and Processor) and subcategories (e.g. downgrades, penalties, value-added services).
Identify your biggest bucket - For most merchants, it's interchange. That's where you'll find the most opportunity.
Audit your data practices - Are you passing AVS and CVV with stored credentials? How's your settlement timing? What's your retry strategy?
Set up monthly monitoring - Don't wait for your annual planning cycle. Costs should be reviewed monthly with a 3-month baseline window.
Want to see exactly where your payment costs are going? Pagos Insights gives you real-time visibility into fees across all your processors, automatically categorized and ready to analyze. Explore how to use custom charts in Pagos Insights to analyze your cost data:
Share this Blog Post
Share this Blog Post
Let's Chat on
Want to dig deeper into payments data, news, and insights? Have hot takes of your own?
We're talking all things payments on Reddit.
Latest Blog Posts
From Internal Experiment to Public Release: Bringing Conversational Payments Data to our Customers via MCP
From Internal Experiment to Public Release: Bringing Conversational Payments Data to our Customers via MCP
From Internal Experiment to Public Release: Bringing Conversational Payments Data to our Customers via MCP

Introducing the Real Talk Payments Podcast
Introducing the Real Talk Payments Podcast
Introducing the Real Talk Payments Podcast
Subscribe to our Blog
Subscribe to
our Blog
Subscribe to our Blog
By submitting, you are providing your consent for future communication in accordance with the Pagos Privacy Policy.
Let's Chat on
Let's Chat on
Want to dig deeper into payments data, news, and insights? Have hot takes of your own?
We're talking all things payments on Reddit.