

Cost Optimization
Cost Optimization
Understand Your
Total Cost of Processing
Powerful cost features give you deep insights into your total cost of payment acceptance. Gain a new level of awareness around fees and penalties so you never overpay again.
Powerful cost features give you deep insights into your total cost of payment acceptance. Gain a new level of awareness around fees and penalties so you never overpay again.
Powerful cost features give you deep insights into your total cost of payment acceptance. Gain a new level of awareness around fees and penalties so you never overpay again.
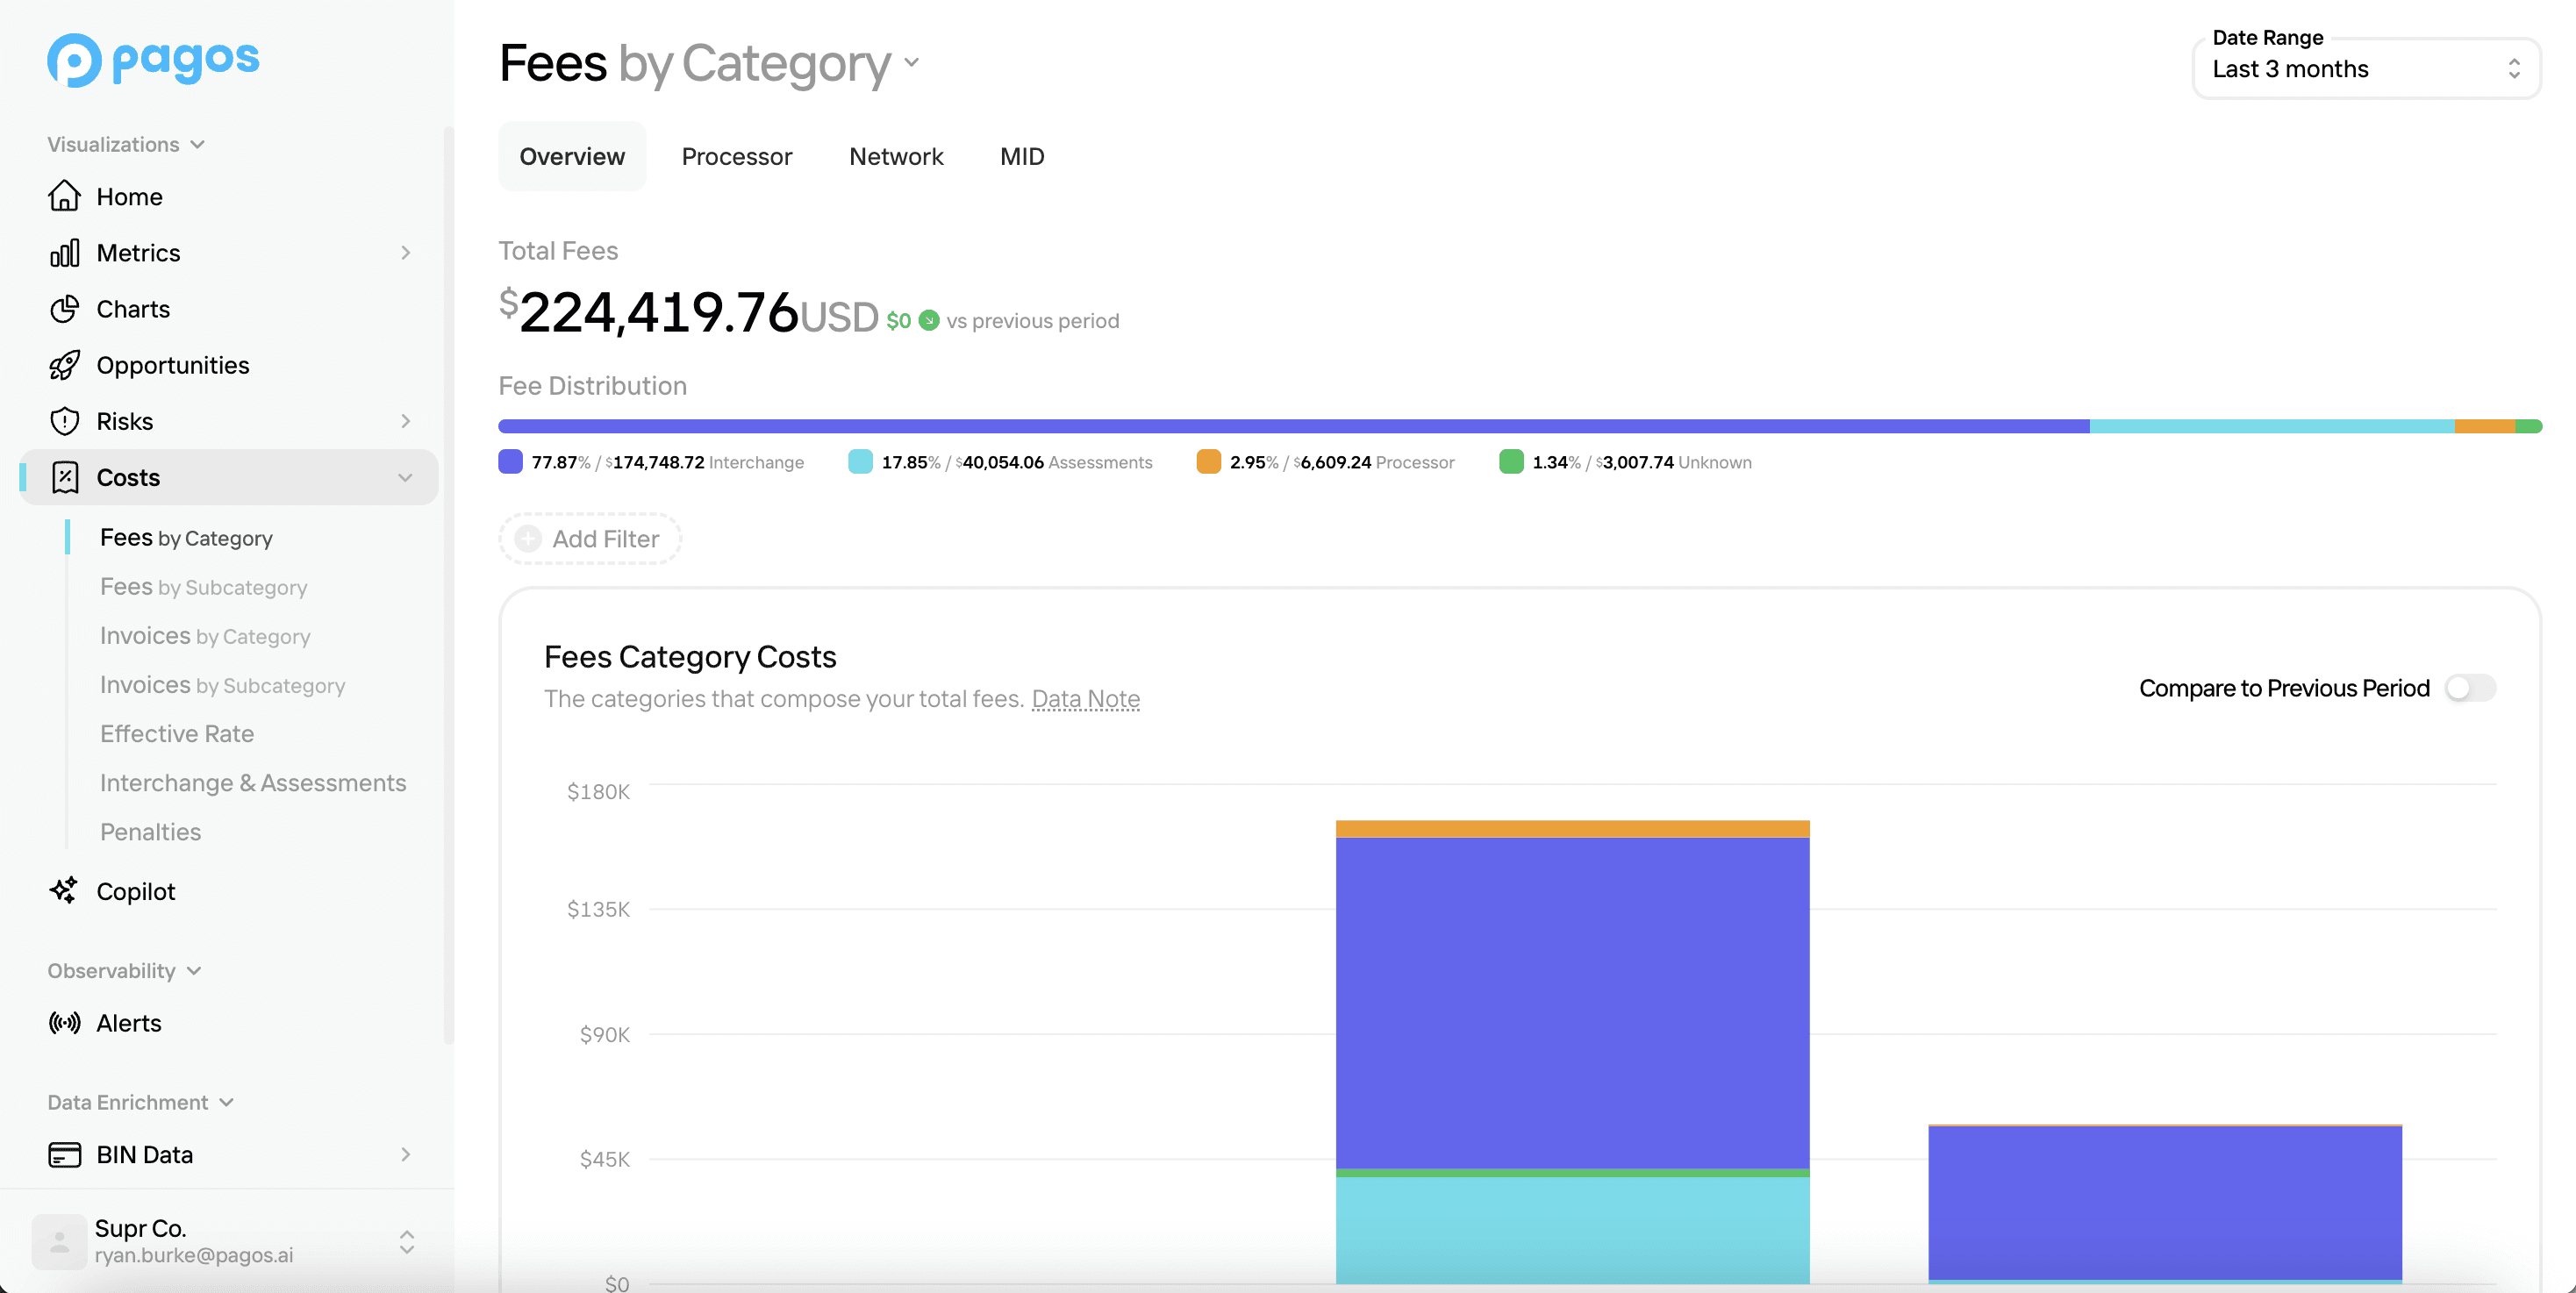
Detail & Depth
Detail & Depth
Detail & Depth
Less Mystery, More Margin
Pagos Costs give unmatched detail into the cost of acceptance across all your processors.
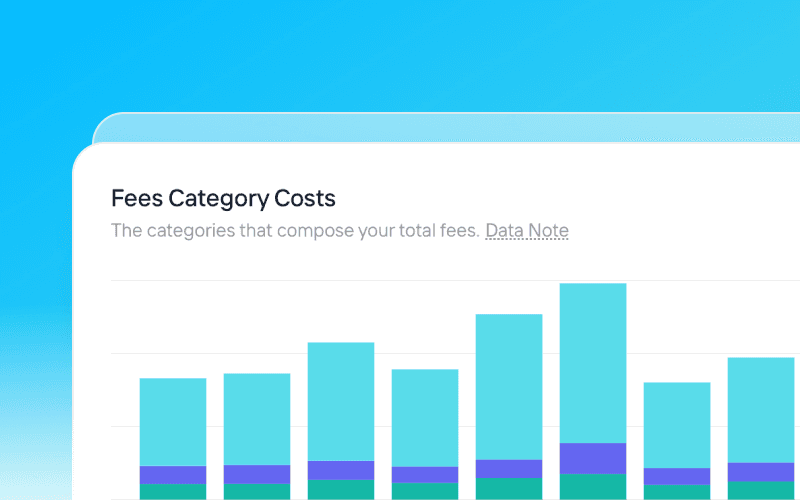
Fees & Invoices
Get full visibility into what you’re paying and why, from interchange to invoice.
Fees & Invoices
Get full visibility into what you’re paying and why, from interchange to invoice.
Fees & Invoices
Get full visibility into what you’re paying and why, from interchange to invoice.
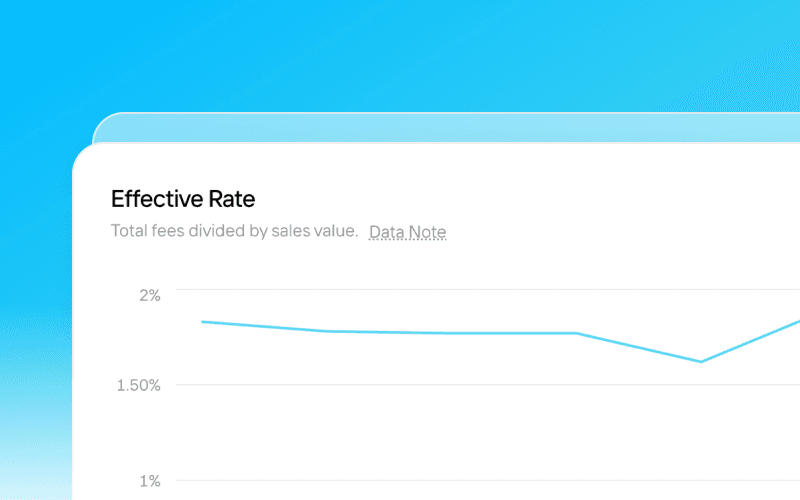
Effective Rate
Your true cost of acceptance with a clear view across processors, networks, and methods.
Effective Rate
Your true cost of acceptance with a clear view across processors, networks, and methods.
Effective Rate
Your true cost of acceptance with a clear view across processors, networks, and methods.
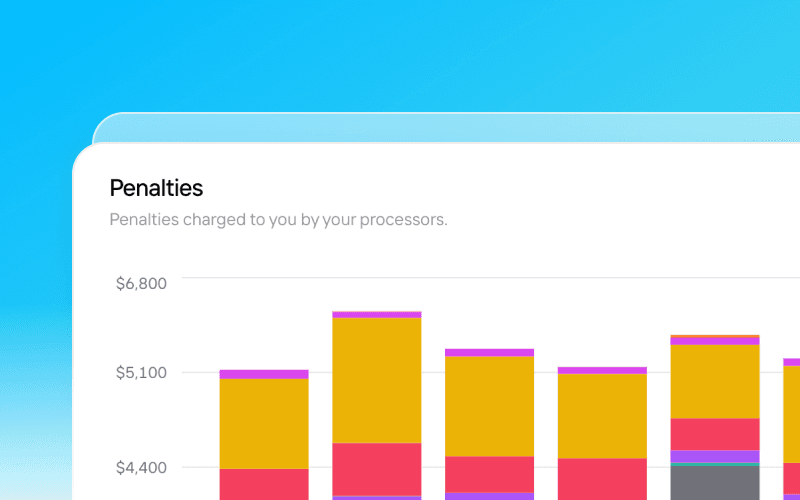
Penalties
Get a detailed breakdown of penalty costs with guidance on how to reduce and prevent them.
Penalties
Get a detailed breakdown of penalty costs with guidance on how to reduce and prevent them.
Penalties
Get a detailed breakdown of penalty costs with guidance on how to reduce and prevent them.
Cost Breakdowns
Cost Breakdowns
Cost Breakdowns
Cost Center to
Command Center
Optimize your costs with tools to break down fees, surface new charges, and track spend at the transaction level.
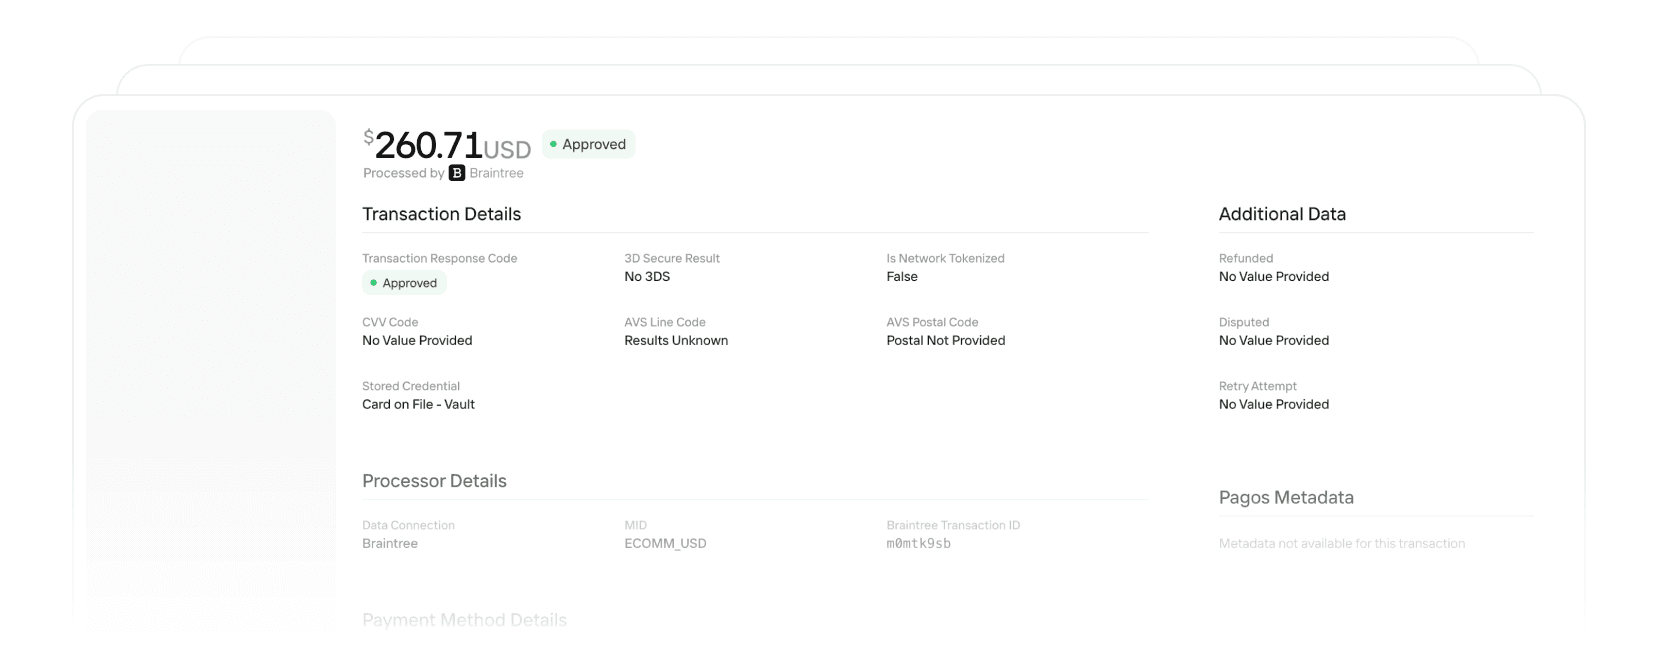
Transaction Level Costs
View the cost of every transaction, with visibility into the factors that shape it—from card type to country.
Transaction Level Costs
View the cost of every transaction, with visibility into the factors that shape it—from card type to country.
Transaction Level Costs
View the cost of every transaction, with visibility into the factors that shape it—from card type to country.
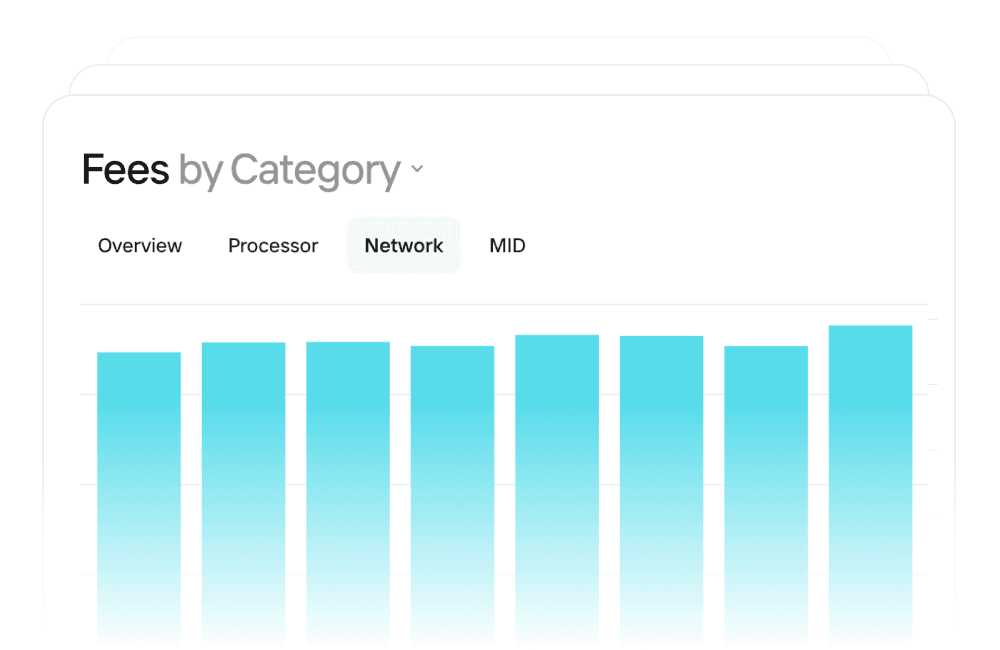
Dive into the Details
Break down costs by processor, network, MID, currency, and more.
Dive into the Details
Break down costs by processor, network, MID, currency, and more.
Dive into the Details
Break down costs by processor, network, MID, currency, and more.
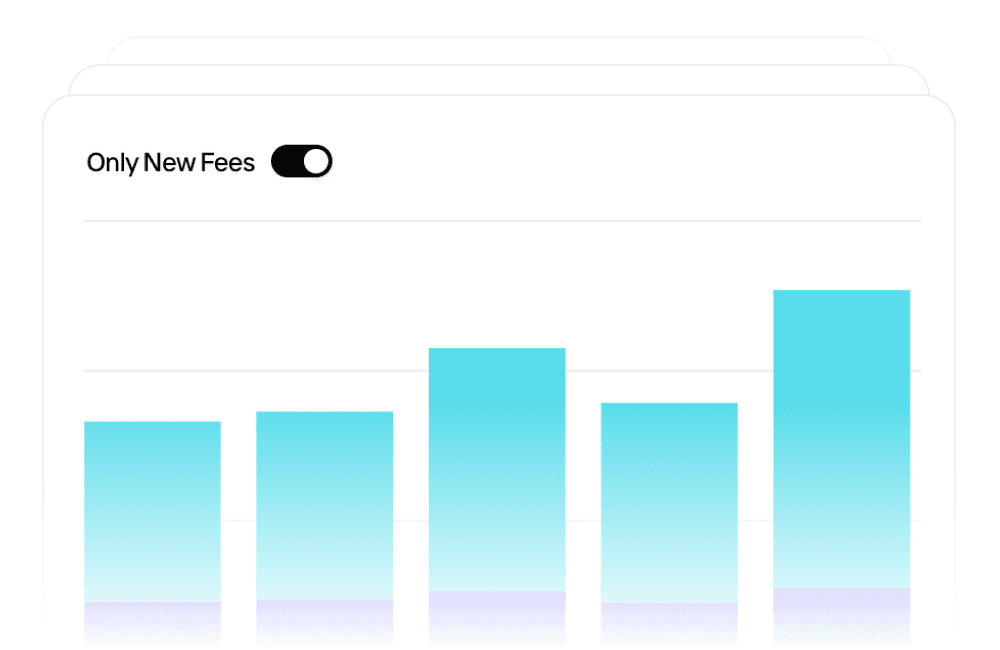
New Fee Detection
See when new fees appear, what they cost, and where they come from.
New Fee Detection
See when new fees appear, what they cost, and where they come from.
New Fee Detection
See when new fees appear, what they cost, and where they come from.
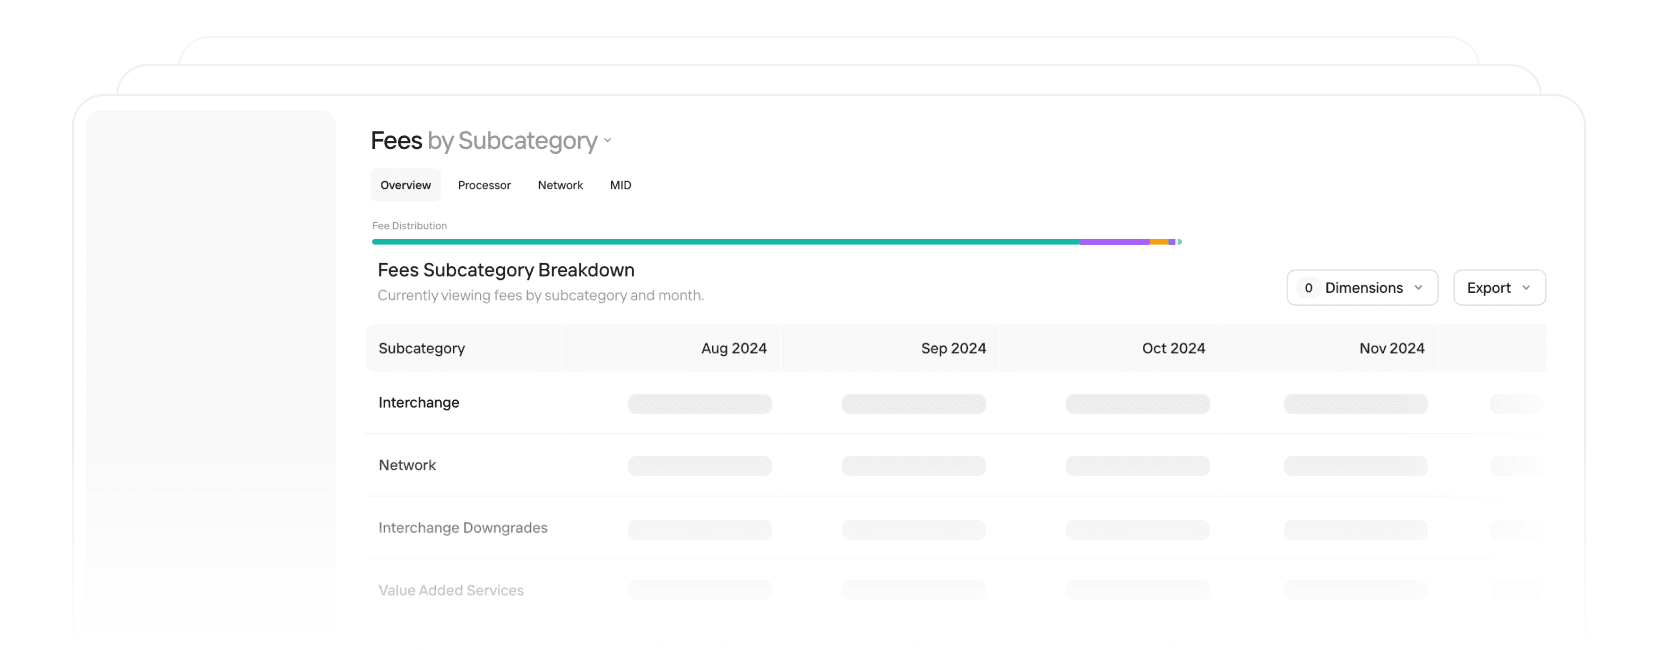
Breakdown by Category & Subcategory
Understand the full makeup of your fees, sorted by category and subcategory for instant clarity.
Breakdown by Category & Subcategory
Understand the full makeup of your fees, sorted by category and subcategory for instant clarity.
Breakdown by Category & Subcategory
Understand the full makeup of your fees, sorted by category and subcategory for instant clarity.
Start Optimizing Costs Today
Optimize your costs and boost your revenue.