AI Insights & Benchmarking
AI Insights & Benchmarking
Insights That
Identify Opportunities
Bring all your payments data together across processors and use analytic dashboards and AI-powered insights to boost approval rates, optimize costs, and understand your customers.
How it Works
How it Works
Instant Setup, Immediate Clarity
Just connect your data and Pagos starts surfacing insights in minutes. No code. No delay. No engineering lift. Just answers.


Effortlessly Connect Your Data
No-code integrations with processors, networks, and fraud providers make it fast to import your data and get started.
Effortlessly Connect Your Data
No-code integrations with processors, networks, and fraud providers make it fast to import your data and get started.
Effortlessly Connect Your Data
No-code integrations with processors, networks, and fraud providers make it fast to import your data and get started.


Discover Insights and Optimizations
Harmonize, label, enrich, and analyze your data across sources to generate actionable insights regardless of where the data was created.
Discover Insights and Optimizations
Harmonize, label, enrich, and analyze your data across sources to generate actionable insights regardless of where the data was created.
Discover Insights and Optimizations
Harmonize, label, enrich, and analyze your data across sources to generate actionable insights regardless of where the data was created.


Access & Export Your Data
Easily access your payments insights via MCP server or insight dashboards, or export to your data warehouse in your preferred format.
Access & Export Your Data
Easily access your payments insights via MCP server or insight dashboards, or export to your data warehouse in your preferred format.
Access & Export Your Data
Easily access your payments insights via MCP server or insight dashboards, or export to your data warehouse in your preferred format.
Core Metrics & Custom Charts
Core Metrics & Custom Charts
Core Metrics & Custom Charts
Key Metrics, Actionable Insights
Key Metrics,
Actionable Insights
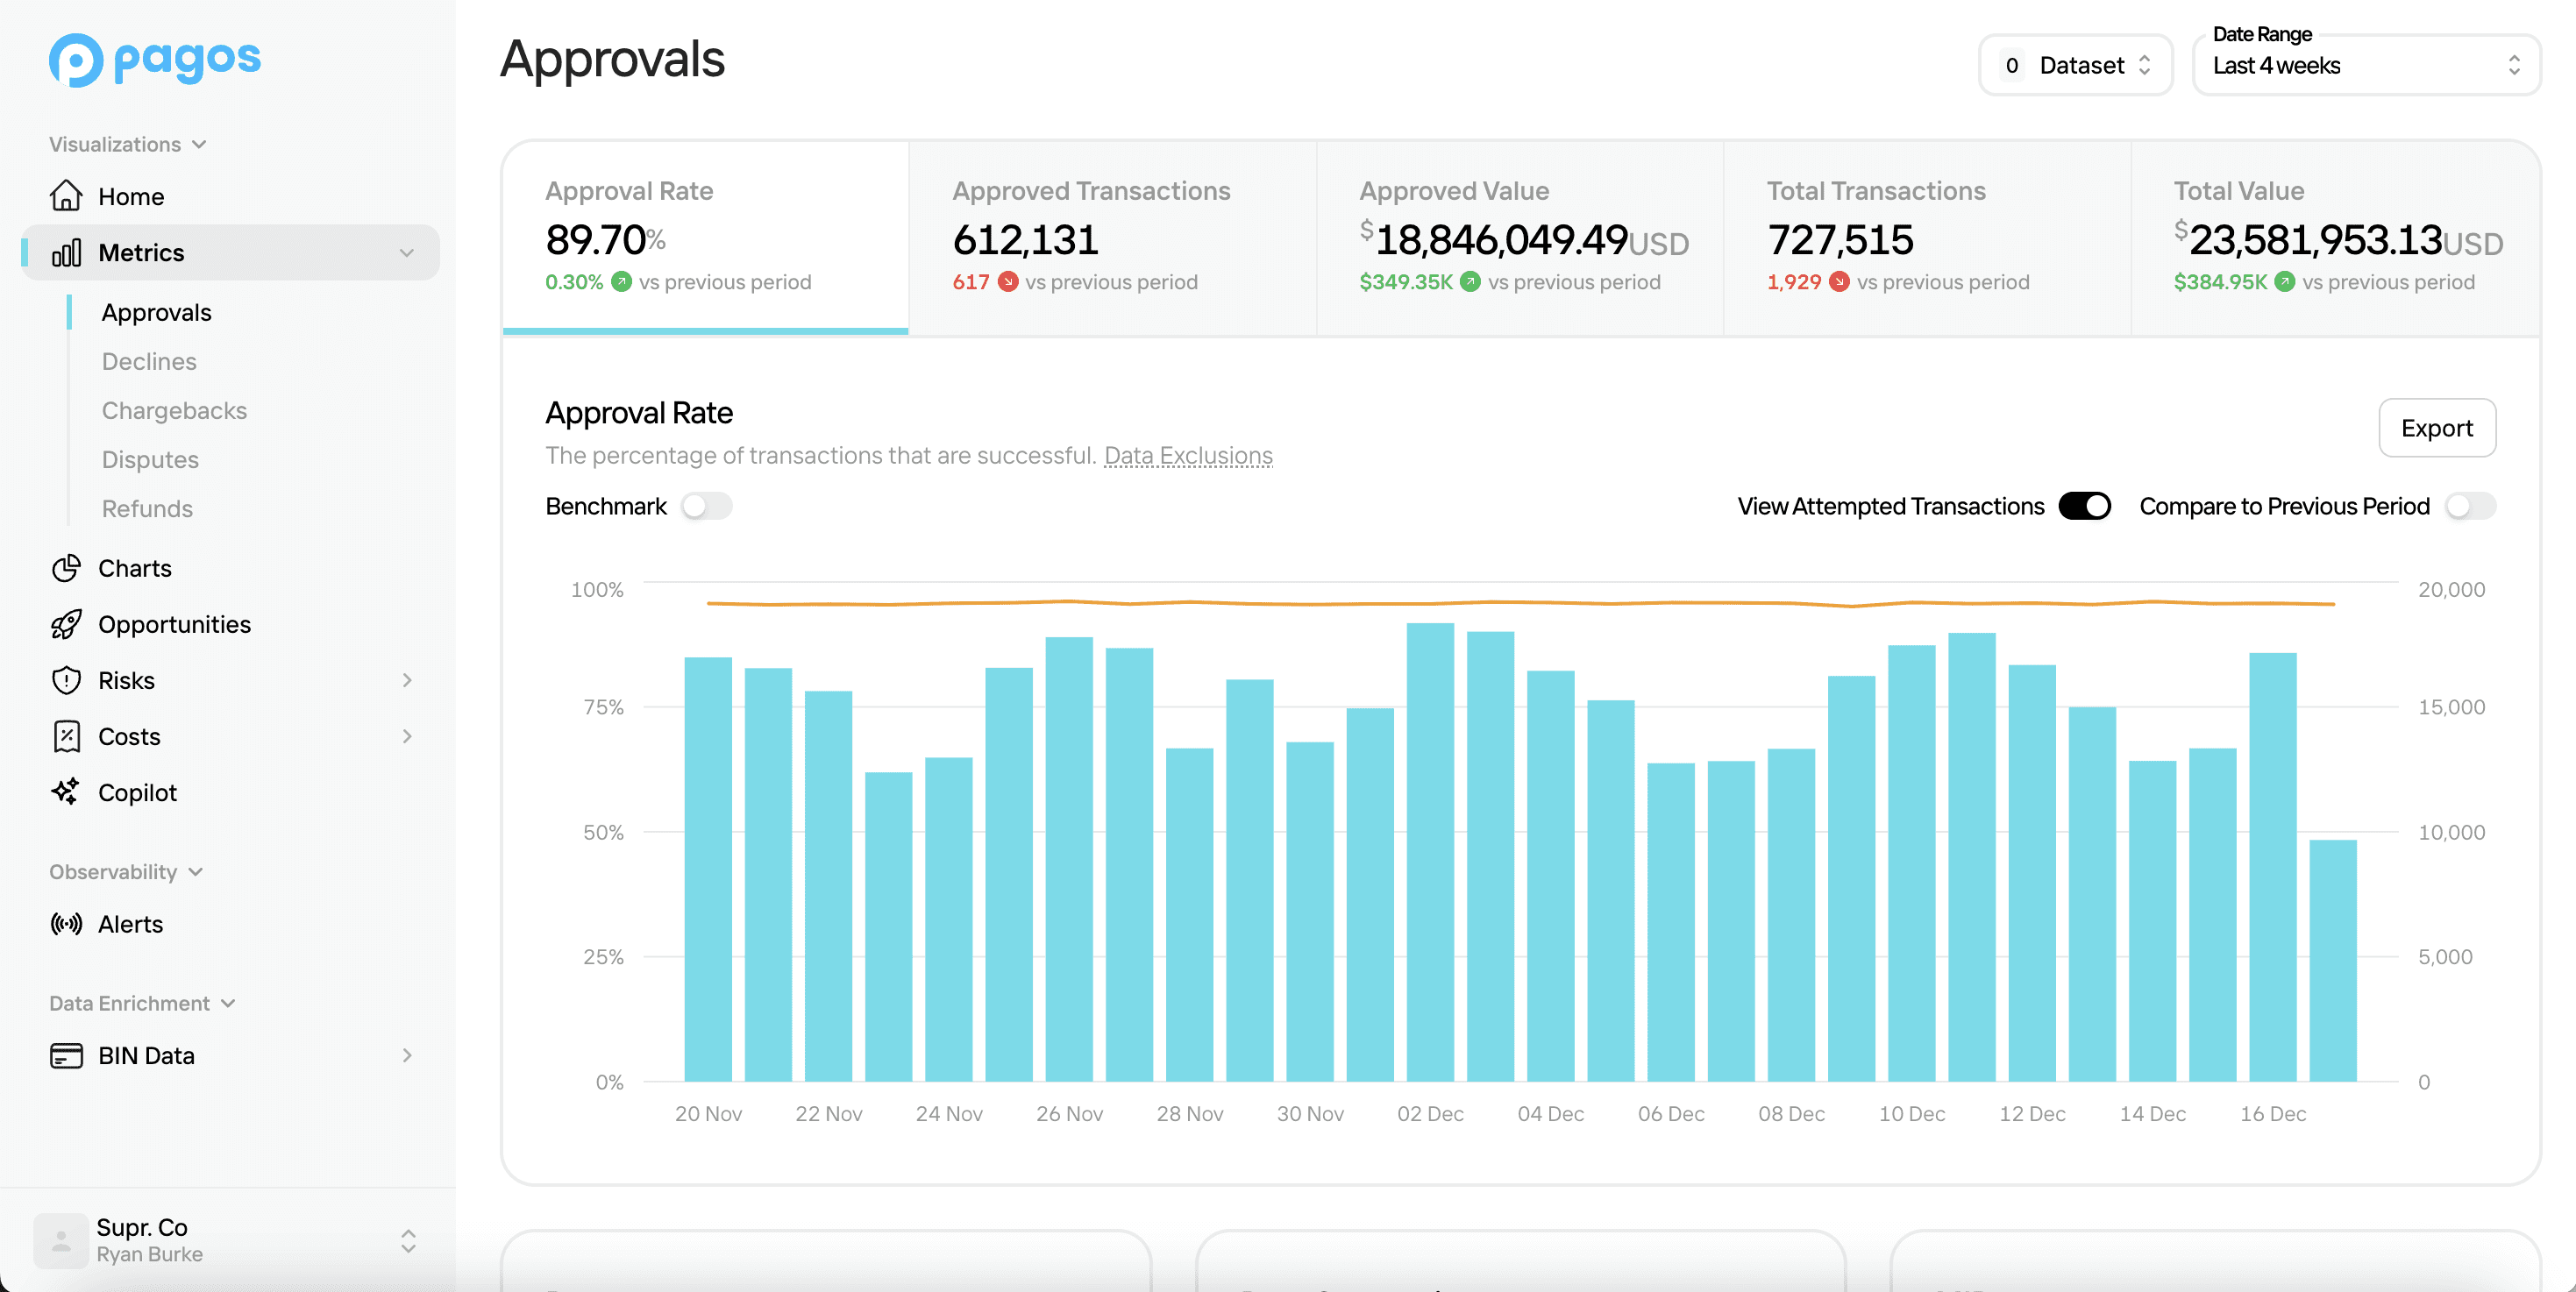
Surface the metrics and KPIs most important to your payments performance—and ultimately, your business. Advanced filtering and detailed breakdowns give you a level of detail you've never had before.
Surface the metrics and KPIs most important to your payments performance—and ultimately, your business. Advanced filtering and detailed breakdowns give you a level of detail you've never had before.
Approvals
Approvals
Approvals
Declines
Declines
Declines
Chargebacks
Chargebacks
Chargebacks
Refunds
Refunds
Refunds
Disputes
Disputes
Disputes
Verifications
Verifications
Verifications
And many more...
And many more...
And many more...


AI Powered
AI Powered
AI Powered
AI That Meets you
Anywhere & Everywhere
AI surfaces new insights and trends throughout Pagos to uncover what you're missing.

Find New Opportunities
Uncover where you're leaving money on the table and cut your processing costs by millions. Identify new strategic possibilities with Level 2 & 3 Data, Network Tokens, Debit Routing, and more.

Find New Opportunities
Uncover where you're leaving money on the table and cut your processing costs by millions. Identify new strategic possibilities with Level 2 & 3 Data, Network Tokens, Debit Routing, and more.

Find New Opportunities
Uncover where you're leaving money on the table and cut your processing costs by millions. Identify new strategic possibilities with Level 2 & 3 Data, Network Tokens, Debit Routing, and more.

Chat With Your Data
Pagos AI answers payments questions. Request specific metrics, chart analytics to dig into trends, and discover insights—all in a conversational interface.

Chat With Your Data
Pagos AI answers payments questions. Request specific metrics, chart analytics to dig into trends, and discover insights—all in a conversational interface.

Chat With Your Data
Pagos AI answers payments questions. Request specific metrics, chart analytics to dig into trends, and discover insights—all in a conversational interface.

AI That Finds Issues You Can't See
AI data analysis calls out the trends you can't see in a traditional dashboard and guides you where to go deeper with your data to solve problems.

AI That Finds Issues You Can't See
AI data analysis calls out the trends you can't see in a traditional dashboard and guides you where to go deeper with your data to solve problems.

AI That Finds Issues You Can't See
AI data analysis calls out the trends you can't see in a traditional dashboard and guides you where to go deeper with your data to solve problems.

Quantify and Forecast your Risk
Detailed fraud, chargeback, and risk insights help you understand if chargebacks are coming in faster than normal, if your fraud rules are tuned correctly, and which chargebacks your team will fight successfully.

Quantify and Forecast your Risk
Detailed fraud, chargeback, and risk insights help you understand if chargebacks are coming in faster than normal, if your fraud rules are tuned correctly, and which chargebacks your team will fight successfully.

Quantify and Forecast your Risk
Detailed fraud, chargeback, and risk insights help you understand if chargebacks are coming in faster than normal, if your fraud rules are tuned correctly, and which chargebacks your team will fight successfully.
Better Together
Better Together
Better Together
More Confidence with More Context
Connect your data and Pagos surfaces insights in minutes.
No code. No delay. No engineering. Just answers.
Connect your data and Pagos surfaces insights in minutes.
No code. No delay. No engineering. Just answers.


Benchmark Against the Best
Anonymously compare your payments performance to industry leaders and peers. Discover opportunities for optimization, recognize trends, and gain confidence.
Benchmark Against the Best
Anonymously compare your payments performance to industry leaders and peers. Discover opportunities for optimization, recognize trends, and gain confidence.
Benchmark Against the Best
Anonymously compare your payments performance to industry leaders and peers. Discover opportunities for optimization, recognize trends, and gain confidence.


Curated by Experts
Pagos highlights the key metrics that drive payments optimization. Analyze what matters most to take performance to the next level.
Curated by Experts
Pagos highlights the key metrics that drive payments optimization. Analyze what matters most to take performance to the next level.
Curated by Experts
Pagos highlights the key metrics that drive payments optimization. Analyze what matters most to take performance to the next level.
Monitoring & Observability
Monitoring & Observability
Monitoring & Observability
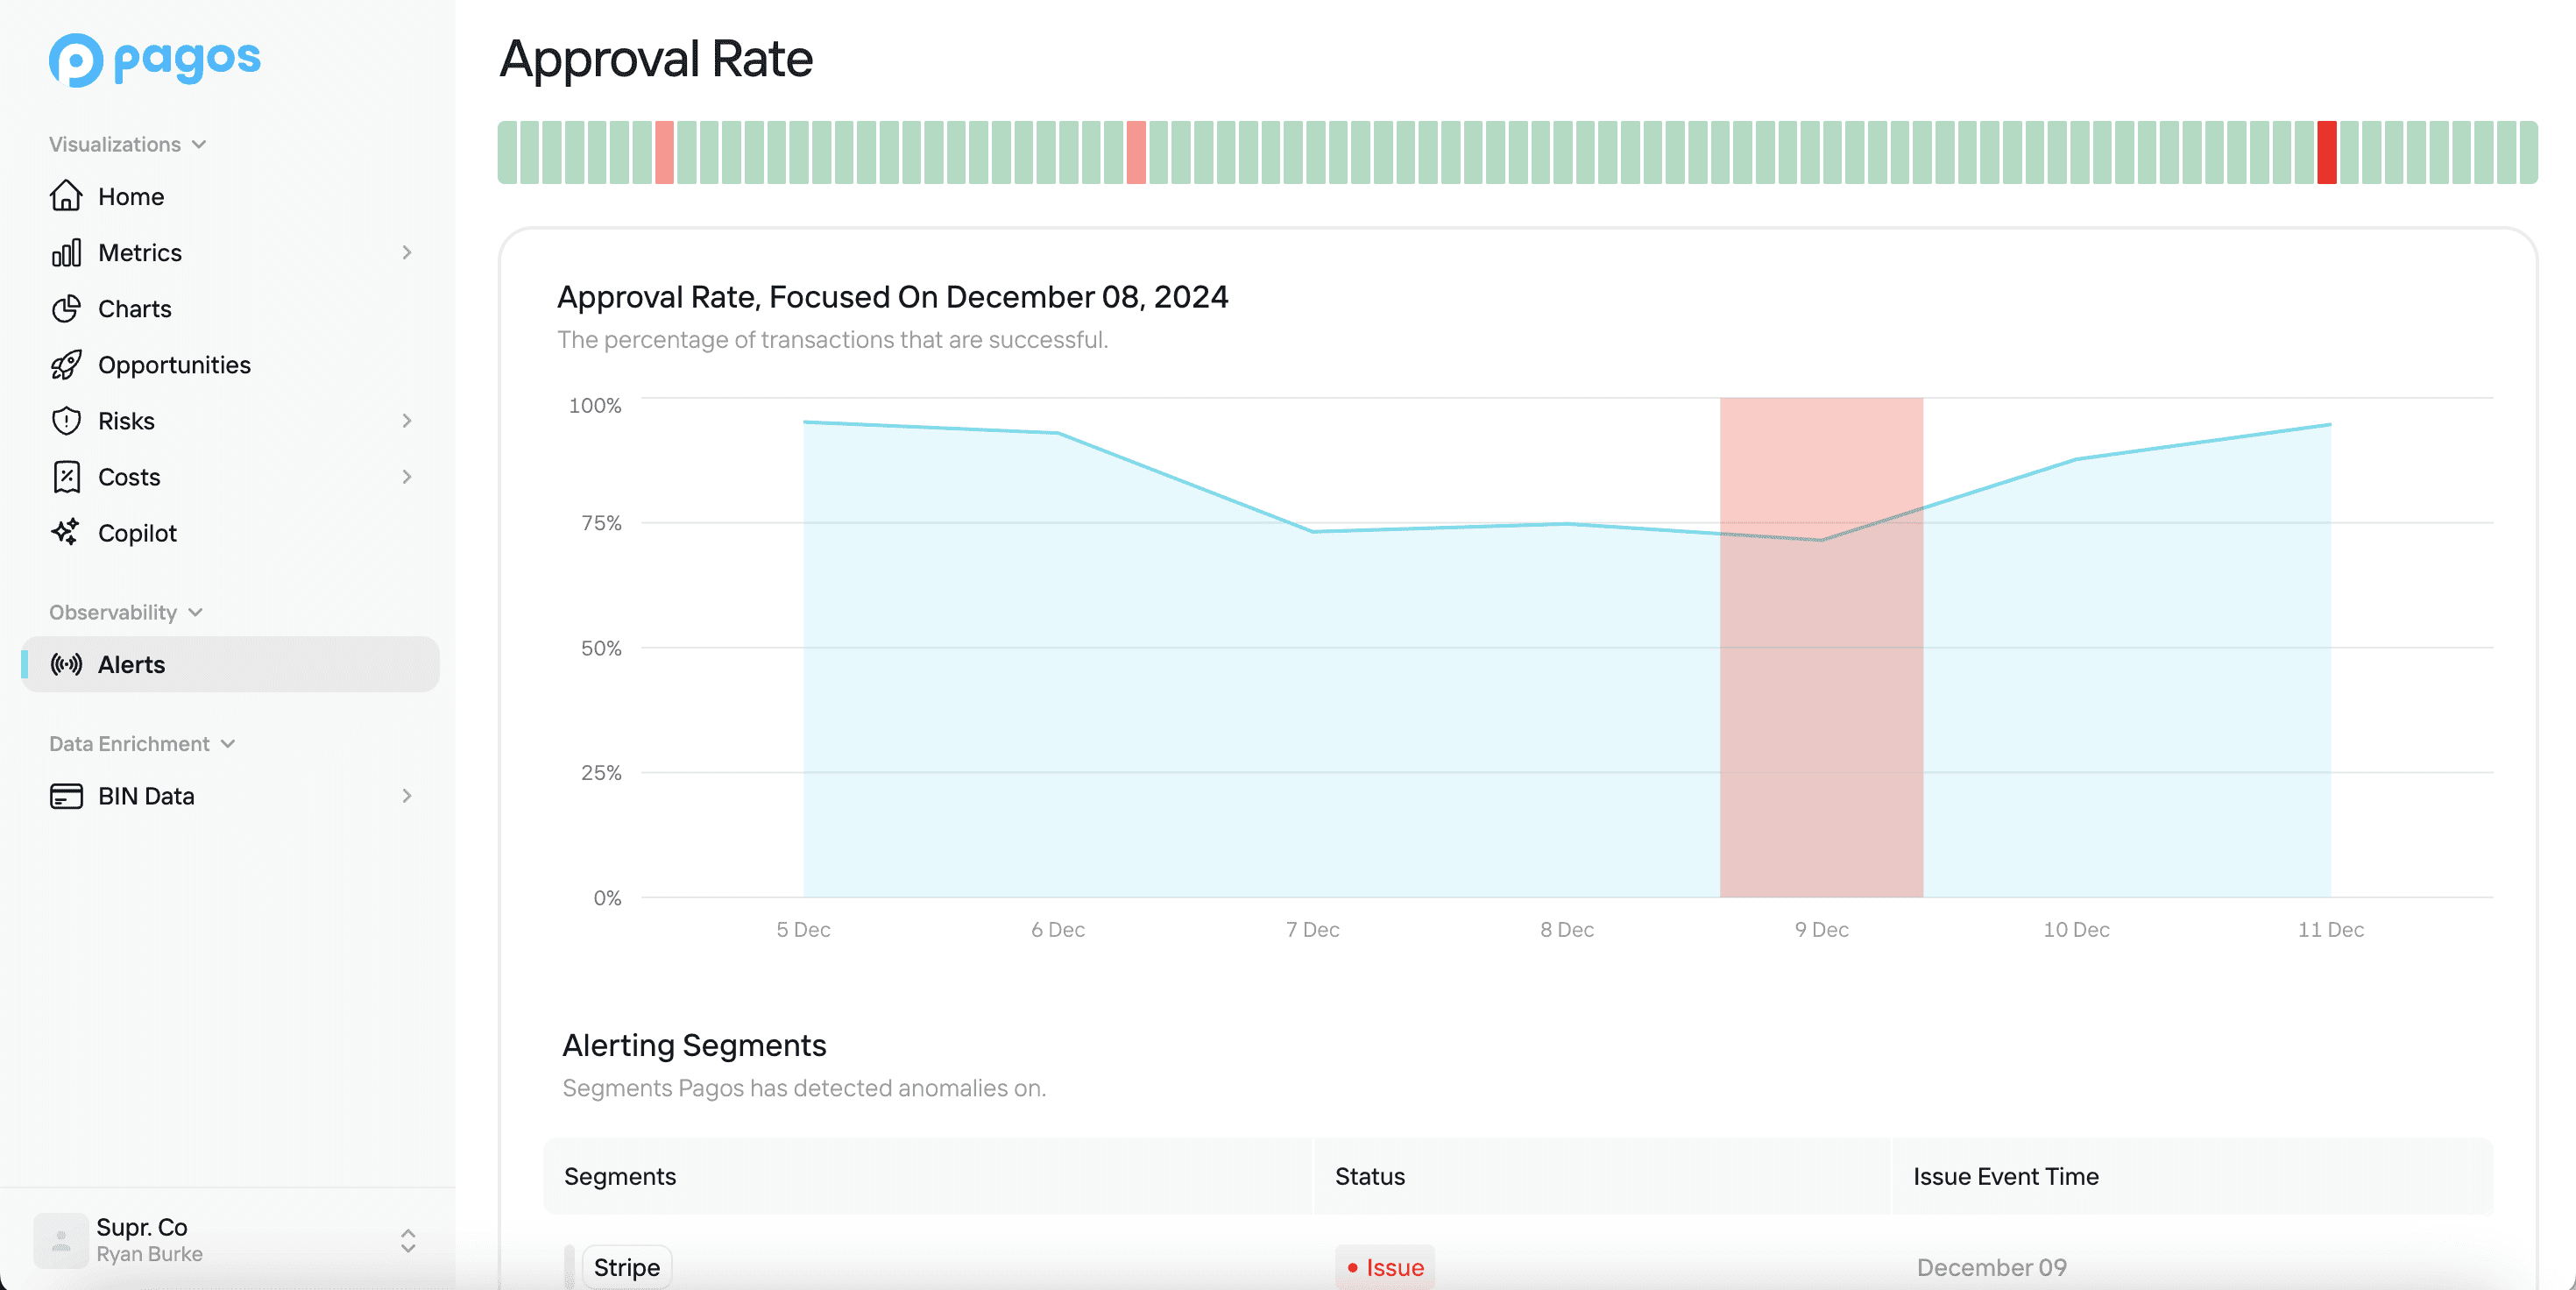
Alert Yourself to Anomalies
Pagos AI monitors your key metrics for dips and drama and instantly alerts you when something's off.
Approval Rate
Approval Rate
Approval Rate
Transaction Count
Transaction Count
Transaction Count
Chargeback Count
Chargeback Count
Chargeback Count
Decline Codes
Decline Codes
Decline Codes


“With Pagos, we can finally see all our data from all our processors apples-to-apples, allowing for easy comparisons of key metrics over regions, time frames, retries, payment methods, and so much more.”
“With Pagos, we can finally see all our data from all our processors apples-to-apples, allowing for easy comparisons of key metrics over regions, time frames, retries, payment methods, and so much more.”
Adam Hollenberg
Payments and Partnerships Senior Manager, Adobe
Insights Are Waiting
Connect your processors and see your first insights this afternoon.

