

Canary
Canary is Singing New Melodies
April 27, 2023
April 27, 2023

Tomas Armellin
Tomas Armellin
Tomas Armellin
At Pagos, we enable teams to view dashboards of advanced payments data visualizations with no code via Peacock. This allows you to see more and clearer information regarding the status of and changes in your payments stack, thus driving more revenue and lower costs. However, machines definitely do a better—and faster—job finding patterns and issues in your data. Not to mention the fact that they work 24/7. That's why we are continually developing and improving Canary, a product that effectively monitors payments performance for you.
We understand how often your systems change these days. Whenever you push out new code, things break or you pick up some new bugs; the same thing is true for your vendors (e.g. payment processors, fraud providers, etc). When these kinds of things happen, the faster you find and address them, the less financial impact they have on your company.
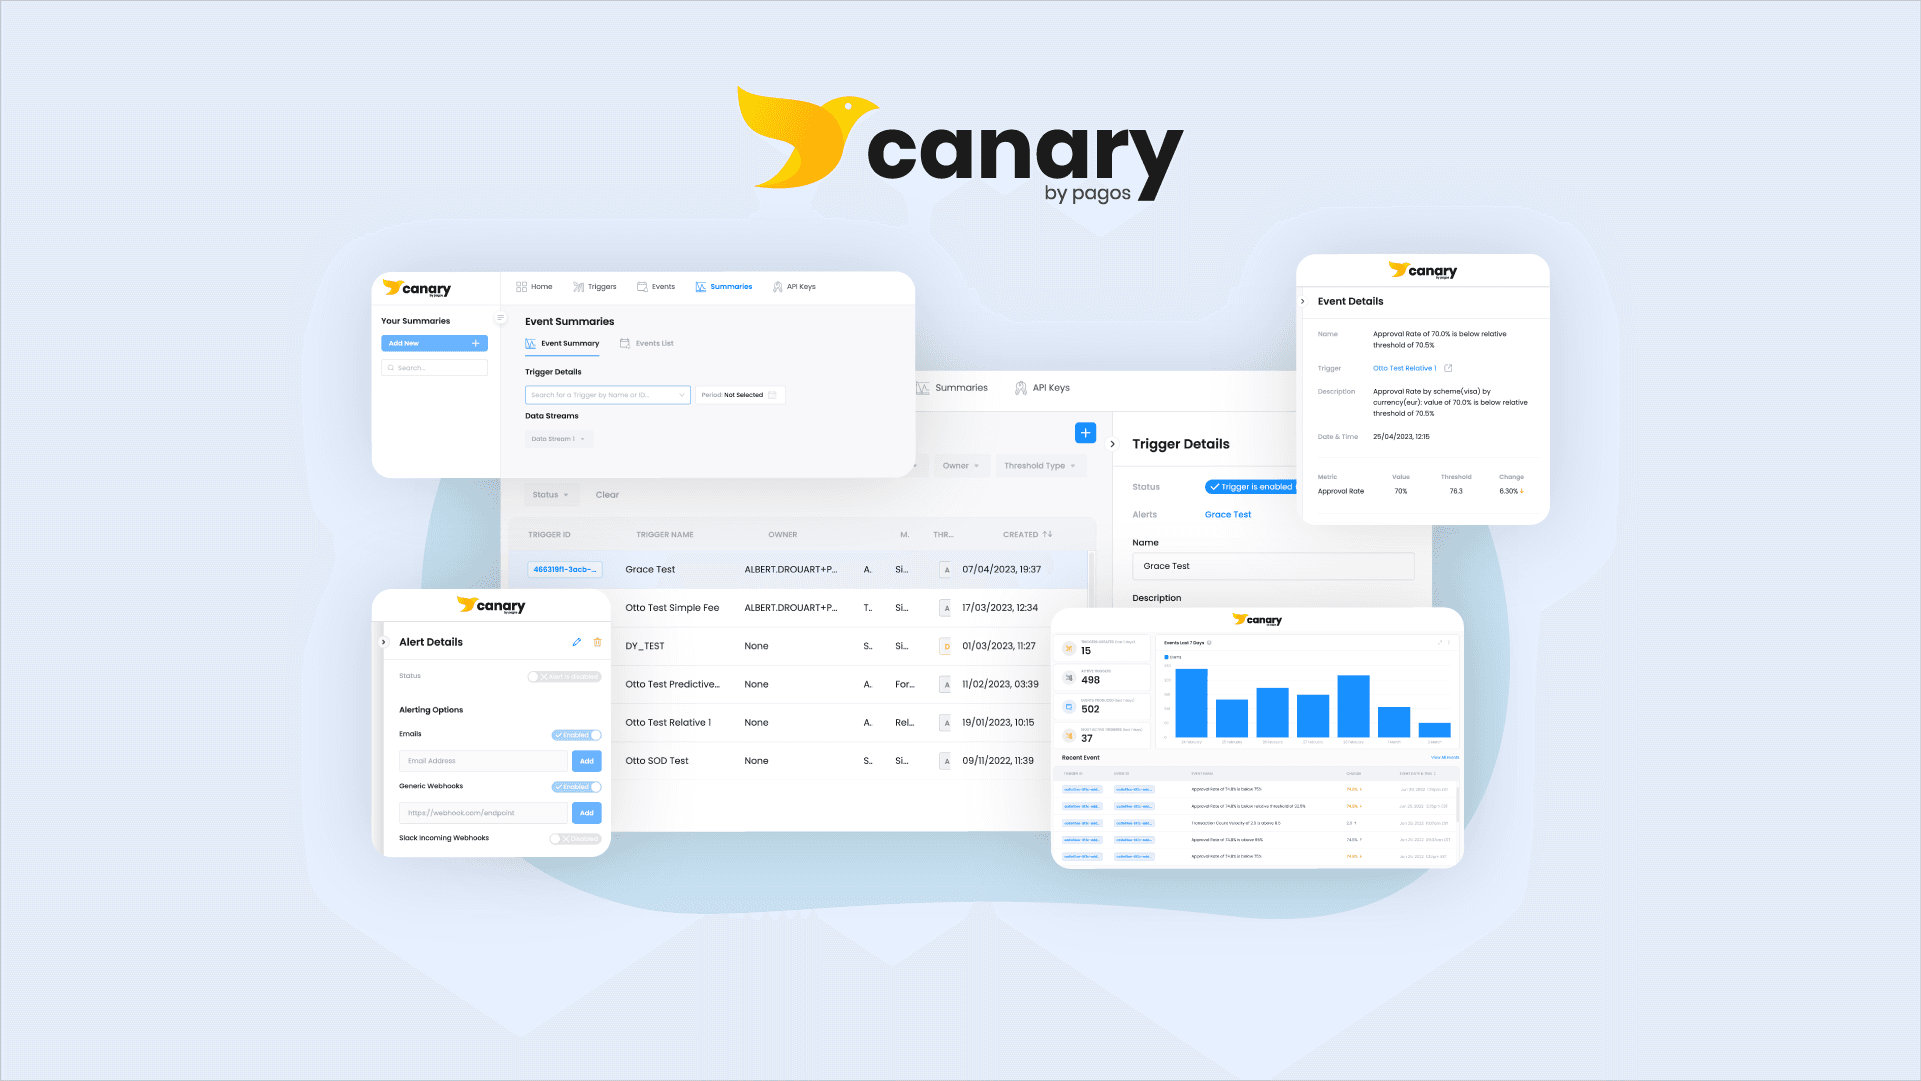
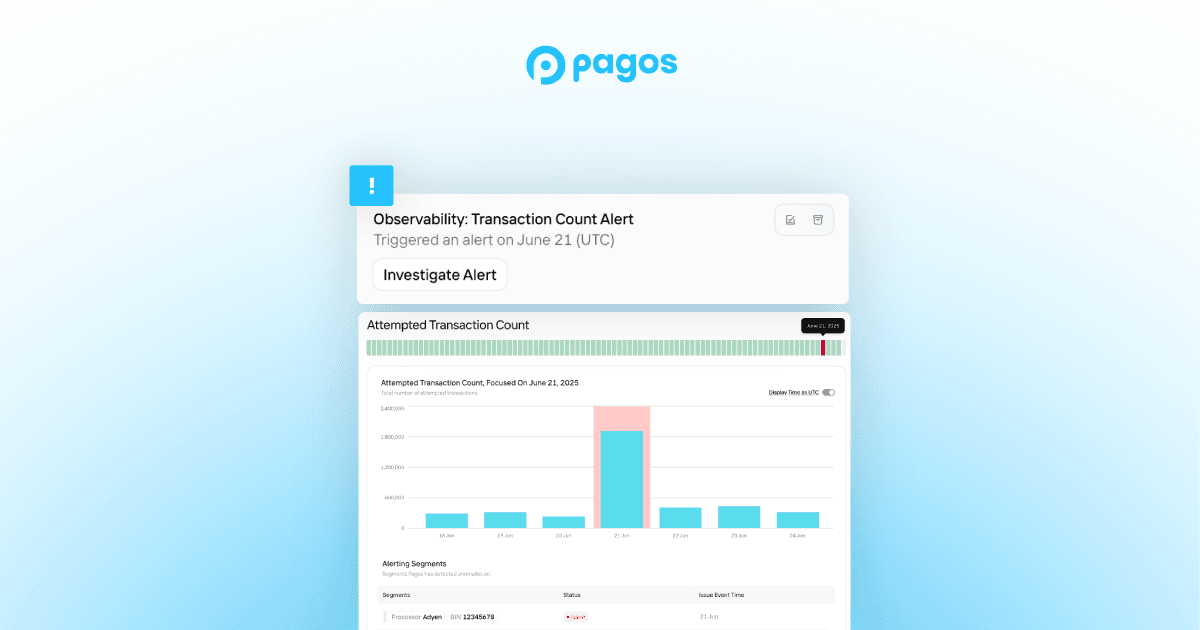
Canary is designed to monitor approval rates, transaction counts, and many other metrics about your payments data, and inform you of significant changes that affect your business. For example, you can monitor BINs known for getting targeted by fraudsters, “catastrophic” declines in transactions, brand-specific approval rates (to your market of choice, or by payment method), and 3DS performance to ensure there are no issues in your payment flow. Canary can even send you real-time alerts via webhook or to your team's inbox when these metrics change dramatically or unexpectedly. In this blog post, we’ll review Canary’s most important features, some changes we’ve introduced, and some new features about to hatch.
Canary Service Panel
Canary by Pagos is here to make payment pattern detection simple. It captures point-in-time metrics called events whenever your payment data meets specific conditions. These conditions include hitting a minimum or maximum threshold or deviating away from past data trends. The Canary Service Panel acts as your central hub for monitoring these events in your payments data. Once you know which metrics require attention, you can take the necessary steps to enhance your payment performance.
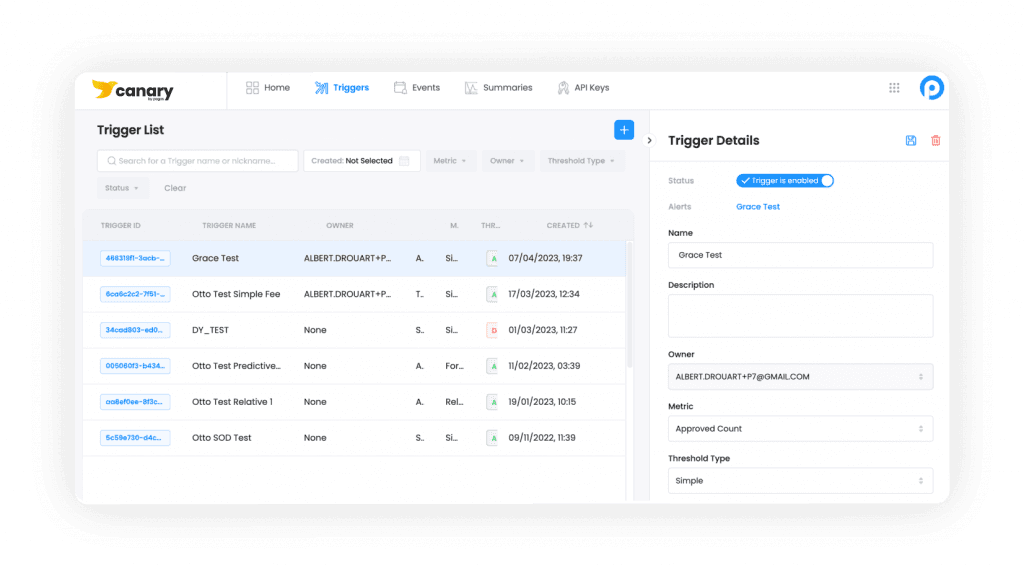
Canary's strength lies in its triggers, which you manually configure according to your specific business needs and concerns. Any time your data changes enough to “trip” one of these triggers, Canary generates an event for this data anomaly or deviation. For example, you can watch for an increase of error declines or 3DS-related declines across your markets. You can even watch for a jump in your fees! In the Triggers page of your Canary Service Panel, you can set new triggers and view a list of existing ones, both active and inactive.
To receive a notification any time a new event fires, simply configure an alert directly from the Triggers page. If you click on an existing trigger or add a new one, a Trigger Details side panel will show up; click the Alerts row to open an Alert Details side panel. Here, you can manage alerts related to that specific trigger.
To examine your event history comprehensively, navigate to the Events page of the Canary Service Panel. Here, you can explore detailed information about each event, including descriptions, related metrics, and timing. Similarly to the Triggers page, you'll find a list of events; click on any one of them to open an Event Details side panel containing more information about the event.
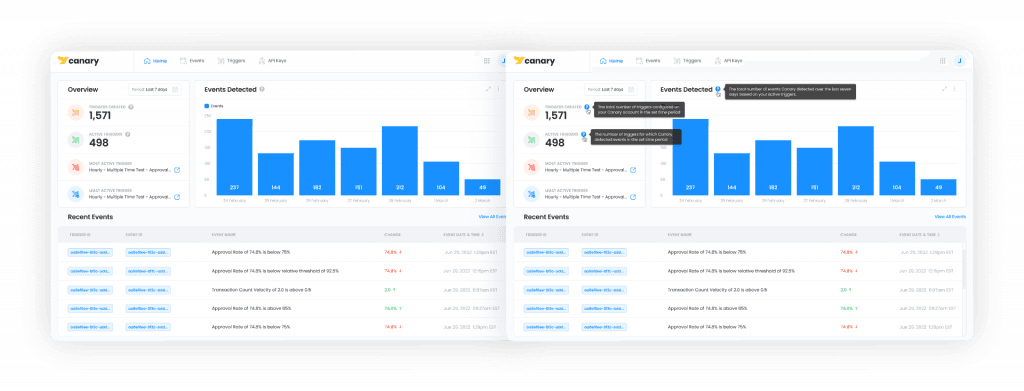
In the recently redesigned Home page of the Canary Service Panel, you’ll now find an overview of statistics and important metrics about the triggers you created, including the most/least active triggers, a chart displaying the event count (filtered by your desired time period), and more. All of these new functionalities have a clear target: helping you reduce noise in your data and keep track of the most important data segments. With Canary, you can easily follow and monitor key metrics to understand your payments performance.
Summaries
Canaries have excellent memories and can remember over 30 different songs. They can also learn new songs quickly. In a similar way, Canary by Pagos not only detects patterns, monitors channels, and predicts opportunities to improve your payments stack, but it’s also regularly acquiring new skills. We’re introducing a new feature in the Canary Service Panel soon: Summaries.
As you know, things are always changing, and payments are no exception to that. We think that viewing each trigger’s performance history helps you understand how you might need to adjust them, add new ones, or even remove triggers that you may no longer need. This is why the Summaries page comes in handy! From this one page, you can see in detail how your triggers are performing and take action based on these insights. We see customers adjusting their trigger configuration to keep pace with the way fraudsters change their patterns, code releases change your processing setup, or rolling out a new payment method changes customer behavior. By identifying your most active triggers and diving deep into the performance and activity of those triggers, you can efficiently adjust how you monitor for key changes.
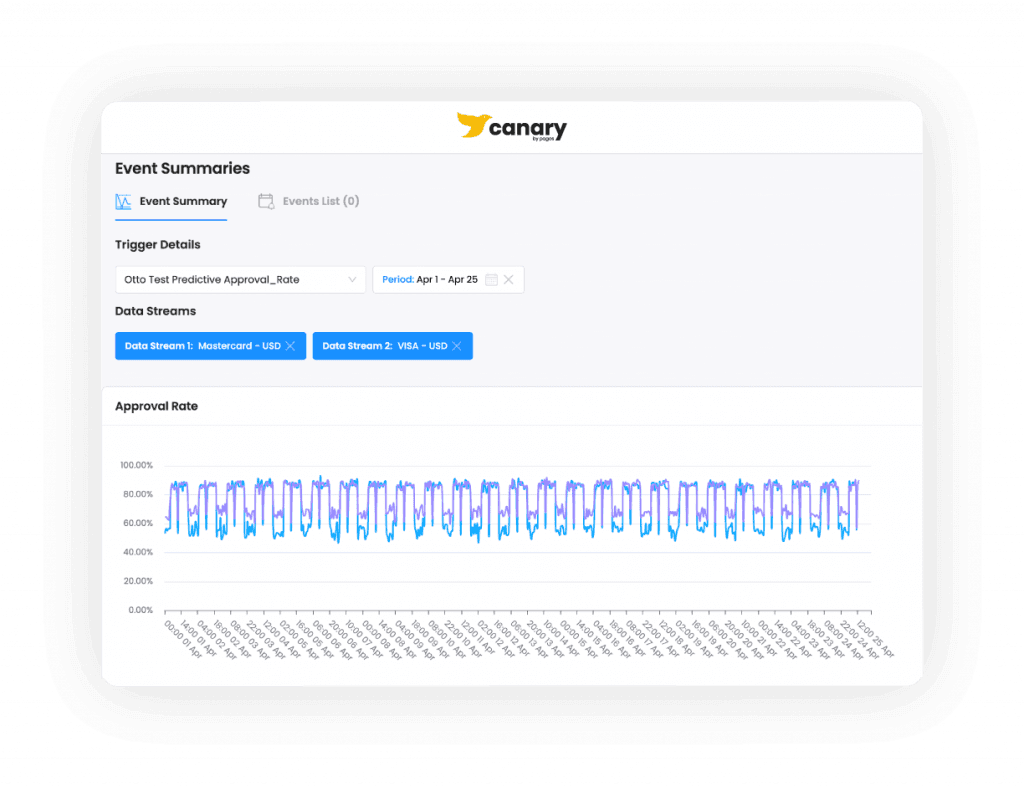
To navigate to this new page, you’ll click Summaries in the navigation bar; here, you can connect together triggers and their events without manual work. Search by trigger ID or event ID to see your actual data, thresholds, and events created by the associated trigger. It includes both a visualization, as well as a table of those events. You’ll find two tabs inside the Summaries page: Event Summary and Events List. In the first one, you can search for a trigger by name or ID and select your desired time period and data stream. After selecting these, you’ll see a chart showing the trigger-related metric over the selected period of time. In the Events List tab, you’ll find the same information as the Events page: a list of all events, with columns displaying event ID, event name, and the related trigger that originated the event.
Get Started
Learn more about how to make the most of Canary in our Pagos Product Documentation. Ready to get started?
At Pagos, we enable teams to view dashboards of advanced payments data visualizations with no code via Peacock. This allows you to see more and clearer information regarding the status of and changes in your payments stack, thus driving more revenue and lower costs. However, machines definitely do a better—and faster—job finding patterns and issues in your data. Not to mention the fact that they work 24/7. That's why we are continually developing and improving Canary, a product that effectively monitors payments performance for you.
We understand how often your systems change these days. Whenever you push out new code, things break or you pick up some new bugs; the same thing is true for your vendors (e.g. payment processors, fraud providers, etc). When these kinds of things happen, the faster you find and address them, the less financial impact they have on your company.
Canary is designed to monitor approval rates, transaction counts, and many other metrics about your payments data, and inform you of significant changes that affect your business. For example, you can monitor BINs known for getting targeted by fraudsters, “catastrophic” declines in transactions, brand-specific approval rates (to your market of choice, or by payment method), and 3DS performance to ensure there are no issues in your payment flow. Canary can even send you real-time alerts via webhook or to your team's inbox when these metrics change dramatically or unexpectedly. In this blog post, we’ll review Canary’s most important features, some changes we’ve introduced, and some new features about to hatch.
Canary Service Panel
Canary by Pagos is here to make payment pattern detection simple. It captures point-in-time metrics called events whenever your payment data meets specific conditions. These conditions include hitting a minimum or maximum threshold or deviating away from past data trends. The Canary Service Panel acts as your central hub for monitoring these events in your payments data. Once you know which metrics require attention, you can take the necessary steps to enhance your payment performance.
Canary's strength lies in its triggers, which you manually configure according to your specific business needs and concerns. Any time your data changes enough to “trip” one of these triggers, Canary generates an event for this data anomaly or deviation. For example, you can watch for an increase of error declines or 3DS-related declines across your markets. You can even watch for a jump in your fees! In the Triggers page of your Canary Service Panel, you can set new triggers and view a list of existing ones, both active and inactive.
To receive a notification any time a new event fires, simply configure an alert directly from the Triggers page. If you click on an existing trigger or add a new one, a Trigger Details side panel will show up; click the Alerts row to open an Alert Details side panel. Here, you can manage alerts related to that specific trigger.
To examine your event history comprehensively, navigate to the Events page of the Canary Service Panel. Here, you can explore detailed information about each event, including descriptions, related metrics, and timing. Similarly to the Triggers page, you'll find a list of events; click on any one of them to open an Event Details side panel containing more information about the event.
In the recently redesigned Home page of the Canary Service Panel, you’ll now find an overview of statistics and important metrics about the triggers you created, including the most/least active triggers, a chart displaying the event count (filtered by your desired time period), and more. All of these new functionalities have a clear target: helping you reduce noise in your data and keep track of the most important data segments. With Canary, you can easily follow and monitor key metrics to understand your payments performance.
Summaries
Canaries have excellent memories and can remember over 30 different songs. They can also learn new songs quickly. In a similar way, Canary by Pagos not only detects patterns, monitors channels, and predicts opportunities to improve your payments stack, but it’s also regularly acquiring new skills. We’re introducing a new feature in the Canary Service Panel soon: Summaries.
As you know, things are always changing, and payments are no exception to that. We think that viewing each trigger’s performance history helps you understand how you might need to adjust them, add new ones, or even remove triggers that you may no longer need. This is why the Summaries page comes in handy! From this one page, you can see in detail how your triggers are performing and take action based on these insights. We see customers adjusting their trigger configuration to keep pace with the way fraudsters change their patterns, code releases change your processing setup, or rolling out a new payment method changes customer behavior. By identifying your most active triggers and diving deep into the performance and activity of those triggers, you can efficiently adjust how you monitor for key changes.
To navigate to this new page, you’ll click Summaries in the navigation bar; here, you can connect together triggers and their events without manual work. Search by trigger ID or event ID to see your actual data, thresholds, and events created by the associated trigger. It includes both a visualization, as well as a table of those events. You’ll find two tabs inside the Summaries page: Event Summary and Events List. In the first one, you can search for a trigger by name or ID and select your desired time period and data stream. After selecting these, you’ll see a chart showing the trigger-related metric over the selected period of time. In the Events List tab, you’ll find the same information as the Events page: a list of all events, with columns displaying event ID, event name, and the related trigger that originated the event.
Get Started
Learn more about how to make the most of Canary in our Pagos Product Documentation. Ready to get started?
Share this Blog Post
Share this Blog Post
Latest Blog Posts
Catching Spikes Before They Burn You: Monitoring BINs to Stay Ahead of Carding Attacks
Catching Spikes Before They Burn You: Monitoring BINs to Stay Ahead of Carding Attacks
Catching Spikes Before They Burn You: Monitoring BINs to Stay Ahead of Carding Attacks

Boosting Pagos’ Engineering Capacity with AI
Boosting Pagos’ Engineering Capacity with AI
Boosting Pagos’ Engineering Capacity with AI
Pagos BIN Data: The Superior Choice for Smarter Payments
Pagos BIN Data: The Superior Choice for Smarter Payments
Pagos BIN Data: The Superior Choice for Smarter Payments
Subscribe to our Blog
Subscribe to
our Blog
Subscribe to our Blog
By submitting, you are providing your consent for future communication in accordance with the Pagos Privacy Policy.