

Peacock
Introducing Fee Visualization in Peacock
December 14, 2022
December 14, 2022

Katie McCarthy
Katie McCarthy
Katie McCarthy

Accepting online payments—and all the tools, systems, and processes required to do so—likely amounts to one of the biggest expenses you have as a business. To make it worse, payments processing notoriously involves a variety of hidden costs and unraveling the true total expense of your payments stack is no easy job. For example, depending on the market and payment method used (e.g. card processing in the US), the data attached to your transactions can change the cost of processing—something you might not know going in or even see broken out in your basic cost data; if the data you send with transactions then changes, either as a result of changes in your own code releases or those of your vendors, your costs could jump without warning.
Additionally, different processors not only categorize their fees differently, but they also present that information to their merchants via different delivery methods. For example, you may receive fee data in your settlement data, via a separate report entirely, or any method in between. Then, in trying to analyze that cost data, you may find that fees between processors or networks don't even seem comparable.
At Pagos, we know that this complexity can drive confusion or, ultimately, a complete lack of insight into the cost of your payments stack. That’s why we released a new dashboard in Peacock to make understanding the cost of payments that much easier: the Costs dashboard. In this set of data visualizations, we combine the power of Pagos data harmonization with the ability to filter for data from different time periods to help companies draw the right conclusions about their fees and make the right decisions that support their business.
The Costs Dashboard
In the Peacock Service Panel, you can now navigate to a new Standard dashboard called the Costs dashboard.
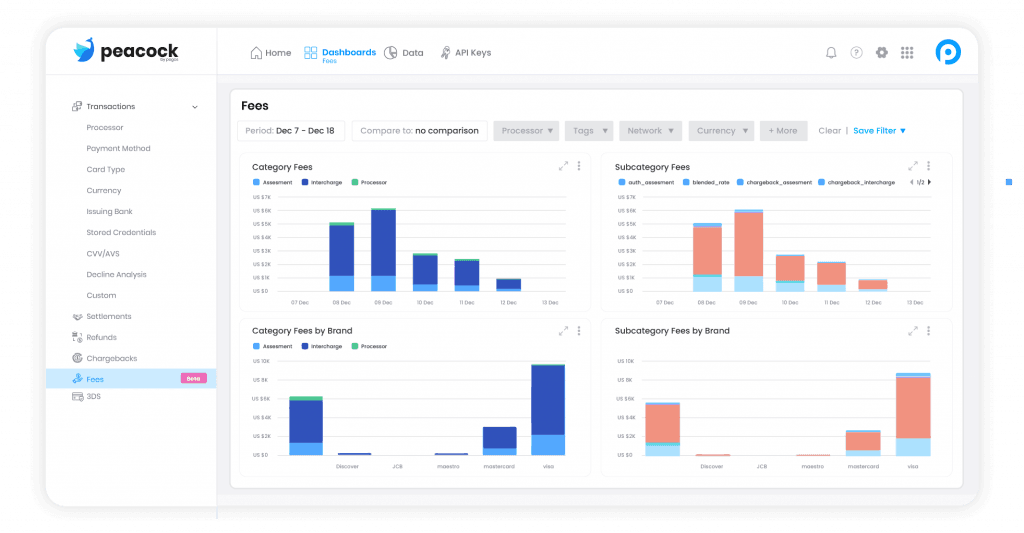
Data harmonization is the foundation of this dashboard. On the back end, we started by mapping all the processor-specific codes for fee types together into three Fee Categories. This allows any company to see fees assessed for the same reason in aggregate! Across your entire payment’s ecosystem, you can finally see how much you're paying for Interchange, Processor fees, and Assessment fees.
Within the dashboard, Fee Categories are further broken down into Fee Subcategories—another Pagos data harmonization—and the fee types provided by each processor. This ensures that you can evaluate and download your fees at the granularity most helpful to you. For example, depending on your processor, your Fee Categories and Subcategories may break down in the following way:
Fee CategoriesFee SubcategoriesInterchangeinterchange
chargeback_interchange
refund_interchangeProcessorblended_rate
Interchange_pricing_fee
processor_misc_feeAssessmentauth_assessment
chargeback_assessment
refund_assessment
To help with your cost analysis, the Costs dashboard includes charts for viewing the fee category and subcategory breakdown across different card brands. Additionally, all Peacock filters are available for use in the Costs Dashboard; use these options to dig deeper into where fees occur, how fees vary across your processors and MIDs, and what types of payment methods result in the most fees for your business. Filters we recommend using with this dashboard include time, processor, MID, card brand, country, and card type. Depending on your internal business and MID structure, these filters can help you understand your fee breakdown by business unit or team, and whether or not your costs are on track. By saving filter combinations as Views, you can recall these data segments easily every time you’re in Peacock, or use them in a Custom dashboard for easy comparison.
What To Look For In Your Fee Data
First and foremost, you want to make sure that your fees are consistent month-over-month or from one billing period to the next. To be abundantly clear: if your processing operations haven’t changed, then your costs shouldn’t change either. Unless you’ve changed who you process with or what you’re processing (i.e. your card and payment method mix), your costs should be relatively consistent over time. If that isn’t the case, that’s your cue to dig deeper into subcategories and fee types or to look at different slices of your data using filters. For example, if you see a material increase in the Assessment fee category, it could mean that there is a change in your technical integration or you missed a compliance change required by your acquirer.
Operationally, let’s look a little bit deeper in what could influence the different fee categories:
Assessment Fees: Assessment fees are driven by card brands and the fees they set for processing, settling, and managing the network of issuing and acquiring banks. These fees also account for any marketing and support for the card brand’s brand mark. Ultimately, they capture how much you process, how you technically process your transactions, and if you’re sensitive to the card brand’s technical rules.
Interchange Fees: Interchange fees are primarily driven by the types of cards you’re processing. If you look at the Card Type dashboard, you can see the split of your transaction volume by card type as well as the performance of each type.
Processor Fees: Processor Fees are what your payment service provider (PSP) or gateway charges you for the technical service they provide, including the connectivity to the card networks and payment methods.
The rest of the Peacock Standard dashboards are great tools to dig deeper into some of these levers that affect costs. Be sure to check out our documentation to learn about everything you can see.
Coming Soon
Today, we have Chase, PayPal Legacy, and Adyen fees mapped into the Costs dashboard in Peacock. We are always working towards data availability, and will have more processors included in fee visualization in 2023, including some of the processors available through our no-code connection options, such as Braintree and Stripe. As always, we provide no-code data ingestion options for the processors you support. You can start visualizing your fee data without developer support.
Don’t see your processor on our current list? Keep checking the Pagos Changelog for regular updates.
Accepting online payments—and all the tools, systems, and processes required to do so—likely amounts to one of the biggest expenses you have as a business. To make it worse, payments processing notoriously involves a variety of hidden costs and unraveling the true total expense of your payments stack is no easy job. For example, depending on the market and payment method used (e.g. card processing in the US), the data attached to your transactions can change the cost of processing—something you might not know going in or even see broken out in your basic cost data; if the data you send with transactions then changes, either as a result of changes in your own code releases or those of your vendors, your costs could jump without warning.
Additionally, different processors not only categorize their fees differently, but they also present that information to their merchants via different delivery methods. For example, you may receive fee data in your settlement data, via a separate report entirely, or any method in between. Then, in trying to analyze that cost data, you may find that fees between processors or networks don't even seem comparable.
At Pagos, we know that this complexity can drive confusion or, ultimately, a complete lack of insight into the cost of your payments stack. That’s why we released a new dashboard in Peacock to make understanding the cost of payments that much easier: the Costs dashboard. In this set of data visualizations, we combine the power of Pagos data harmonization with the ability to filter for data from different time periods to help companies draw the right conclusions about their fees and make the right decisions that support their business.
The Costs Dashboard
In the Peacock Service Panel, you can now navigate to a new Standard dashboard called the Costs dashboard.
Data harmonization is the foundation of this dashboard. On the back end, we started by mapping all the processor-specific codes for fee types together into three Fee Categories. This allows any company to see fees assessed for the same reason in aggregate! Across your entire payment’s ecosystem, you can finally see how much you're paying for Interchange, Processor fees, and Assessment fees.
Within the dashboard, Fee Categories are further broken down into Fee Subcategories—another Pagos data harmonization—and the fee types provided by each processor. This ensures that you can evaluate and download your fees at the granularity most helpful to you. For example, depending on your processor, your Fee Categories and Subcategories may break down in the following way:
Fee CategoriesFee SubcategoriesInterchangeinterchange
chargeback_interchange
refund_interchangeProcessorblended_rate
Interchange_pricing_fee
processor_misc_feeAssessmentauth_assessment
chargeback_assessment
refund_assessment
To help with your cost analysis, the Costs dashboard includes charts for viewing the fee category and subcategory breakdown across different card brands. Additionally, all Peacock filters are available for use in the Costs Dashboard; use these options to dig deeper into where fees occur, how fees vary across your processors and MIDs, and what types of payment methods result in the most fees for your business. Filters we recommend using with this dashboard include time, processor, MID, card brand, country, and card type. Depending on your internal business and MID structure, these filters can help you understand your fee breakdown by business unit or team, and whether or not your costs are on track. By saving filter combinations as Views, you can recall these data segments easily every time you’re in Peacock, or use them in a Custom dashboard for easy comparison.
What To Look For In Your Fee Data
First and foremost, you want to make sure that your fees are consistent month-over-month or from one billing period to the next. To be abundantly clear: if your processing operations haven’t changed, then your costs shouldn’t change either. Unless you’ve changed who you process with or what you’re processing (i.e. your card and payment method mix), your costs should be relatively consistent over time. If that isn’t the case, that’s your cue to dig deeper into subcategories and fee types or to look at different slices of your data using filters. For example, if you see a material increase in the Assessment fee category, it could mean that there is a change in your technical integration or you missed a compliance change required by your acquirer.
Operationally, let’s look a little bit deeper in what could influence the different fee categories:
Assessment Fees: Assessment fees are driven by card brands and the fees they set for processing, settling, and managing the network of issuing and acquiring banks. These fees also account for any marketing and support for the card brand’s brand mark. Ultimately, they capture how much you process, how you technically process your transactions, and if you’re sensitive to the card brand’s technical rules.
Interchange Fees: Interchange fees are primarily driven by the types of cards you’re processing. If you look at the Card Type dashboard, you can see the split of your transaction volume by card type as well as the performance of each type.
Processor Fees: Processor Fees are what your payment service provider (PSP) or gateway charges you for the technical service they provide, including the connectivity to the card networks and payment methods.
The rest of the Peacock Standard dashboards are great tools to dig deeper into some of these levers that affect costs. Be sure to check out our documentation to learn about everything you can see.
Coming Soon
Today, we have Chase, PayPal Legacy, and Adyen fees mapped into the Costs dashboard in Peacock. We are always working towards data availability, and will have more processors included in fee visualization in 2023, including some of the processors available through our no-code connection options, such as Braintree and Stripe. As always, we provide no-code data ingestion options for the processors you support. You can start visualizing your fee data without developer support.
Don’t see your processor on our current list? Keep checking the Pagos Changelog for regular updates.
Share this Blog Post
Share this Blog Post
Latest Blog Posts
Payments Intelligence Requires Intelligent Payments Tools
Payments Intelligence Requires Intelligent Payments Tools
Payments Intelligence Requires Intelligent Payments Tools
Catching Spikes Before They Burn You: Monitoring BINs to Stay Ahead of Carding Attacks
Catching Spikes Before They Burn You: Monitoring BINs to Stay Ahead of Carding Attacks
Catching Spikes Before They Burn You: Monitoring BINs to Stay Ahead of Carding Attacks

Boosting Pagos’ Engineering Capacity with AI
Boosting Pagos’ Engineering Capacity with AI
Boosting Pagos’ Engineering Capacity with AI
Subscribe to our Blog
Subscribe to
our Blog
Subscribe to our Blog
By submitting, you are providing your consent for future communication in accordance with the Pagos Privacy Policy.