

Products
Why Peacock and Canary are for Everyone
November 3, 2022
November 3, 2022

Katie McCarthy
Katie McCarthy
Katie McCarthy

If you’ve been keeping up with the Pagos flock, you know that the information available in Peacock and Canary grows every day. If you’re not sure where to begin, that’s okay! Transaction data is sometimes confusing and overwhelming, and we’re here to help make sense of it all.
Payments are a great indicator of the health of any business. If your job deals with payments operations, risk and fraud, customer experience, or finance, you have something to gain by paying attention to payments performance. And in the modern world we’re living in, being more data-driven in your decision making is always a good idea. Let’s take a look at how Peacock can benefit your team.
Payments Operations
An easy place to start is within Payments Operations teams themselves. If you’re on a Payments Ops team, you have a lot to gain from the immediate visualization of the Peacock dashboards. Some of the key details you’d want to monitor are displayed every time you log in on the Home dashboard.

At Pagos, we think of the Home dashboard as a health check of your payments operations. Here, you’ll find key metrics like average order value (AOV), transaction volume, and chargeback rate. With these metrics, you can track not only the health of the business, but the performance of payments operations before and after authorization.
As a payments operations professional, you might check turnover, AOV, and approval rates to make sure that those key performance indicators look as expected. If nothing is out of place, you may want to dig deeper using the chart library within the Peacock Standard dashboards. Standard dashboards break out the transaction lifecycle—from transaction through settlement—into individual dashboards and charts. The Processor dashboard, for example, breaks out payments data by processor and can help answer questions like "Where in my payment stack are there incomplete sales?“ or “Is my transaction volume trending in the right direction?”
When evaluating or comparing processor performance, we recommend looking beyond transaction share or approval rates. If everything looks fine at the surface, other views of data might show you which part of your payments stack is suboptimal. You may find answers within processor decline codes. An easy and addressable place to start is any error-based decline. For example, a spike in decline_gateway could indicate a bug in your gateway integration, or a spike in refer_to_issuer with your European processor might mean that you have authentication or 3DS errors due to an integration. Both issues may be remediated with your development team.
If you think you’ve addressed any integration issues with your development team, you might want to track the transaction count of those specific decline codes by configuring a trigger in Canary. That way, you’ll know if you successfully remediated the issue.
If you’re looking for more cost risk in your business—or are on a Risk and Fraud team—you may want to pay more attention to the refunds and chargeback dashboards.
Risk and Fraud
If you’re on a Risk and Fraud team, you’re likely paying the most attention to chargeback and refund activity. Peacock comes equipped with pre-made and immediately populated dashboards for both!
On the Chargebacks dashboard, you can answer questions like:
“Is my chargeback volume due to fraud or operations?”,
“What BINs are being targeted for fraud?”
“How many chargeback cases do we win?”
For the first question, a great way to understand where chargebacks come from is by filtering a whole dashboard by card type. Card type (e.g., credit, debit, prepaid) can approximate large customer segments; if you find a disproportionate number of chargebacks come from a card type that’s unusual to your business, it’s worth investigating potential fraud.
If you want to conduct more granular analysis, look at the BIN data, specifically the Top 25 Chargebacks by BINs chart in the Chargebacks dashboard. Sometimes bad actors will target particular BINs for chargeback schemes.

If you find any suspicious BIN activity, you can monitor the chargeback rate by BIN in Canary. Instead of checking back every day, let Canary do the monitoring for you! It will let you know whenever a change is enough to warrant your attention.
You’ll find similar dissections of data within the Refunds dashboards. There, you can see overall refund volume and refunds by BIN. You can, of course, always filter any of the dashboards by any data attribute most meaningful to your business.
So far, we’ve talked about potential costs and risks to your business. What about growth?
Payments Product Development, Payments Partnerships, and Checkout Customer Experience
If you’re on a team that focuses on payment product development, partnerships, and customer experience, you may be trying to answer questions like, “Which payment methods and card types are successfully making it through checkout?”
To answer this question, you could start in Peacock’s Card Type dashboard or Payment Method dashboard. In these dashboards, you can look at the distribution transactions, approvals, and declines by card types and by payment method. As mentioned above, card type can be a good approximation of your customer segments; by looking specifically at approval volume and decline rates, you can tell which customers aren’t making it through checkout. If you’re not capturing customer segments you want, or if your checkout is blocking customers you don’t want blocked, you need to make adjustments to your customer experience.

In Canary, you can configure triggers for approval rate and decline rate by card types. That way, you’ll receive notifications when you attract or lose the card types—and customers—you want.
When payments growth is on your mind, you may be looking to compare processors. A great time to look at processor comparison is when you’re onboarding a new payments processor. In this scenario, you can track the approval rate of your new processor as volume increases; if it’s not meeting the benchmarked standard of prior performance, first start by comparing the transaction volume and transaction messaging you're sending to both processors. Before you contact your new processor’s account management team, make sure that each processor is getting the exact same information–then you can truly isolate performance.
Finance
If you’re on a Finance team, you’ll likely start by using Peacock to trace high-level trends over time. On the revenue side, you’ll want to understand the health of your sales. Turnover, AOV, and the distribution of stored credentials can tell you whether your sales are consistent over time and if your subscription business is healthy. To conduct this analysis, review the Turnover and Average Order Value chart in the Home dashboard, or filter any chart on any dashboard by Stored Credential.
With Canary, you can monitor the health of your sales over time by setting up Transaction Counts and AOV triggers. That way, if your business experiences a decrease in transaction volume, you’ll know right away.
On the cost side of the business, we recommend keeping an eye on your card type, payment method, and card brand mixes, as these are going to be your biggest drivers of interchange. If you filter Peacock charts and dashboards with the Card Brand filter and notice a shift to more premium cards, for example, you can expect that your payments costs are going to go up. It might be worth connecting with your marketing team to see if the acquisition of that customer segment was intentional and will outweigh the future cost.
If things don’t look quite right on the top level and you’re a marketplace business, your next step might be to look at your submerchant performance to see who is driving the most revenue and cost. You can bring submerchant data into Peacock through the soft descriptor filter.

Any team can benefit from Peacock and Canary. They allow you to access the power of your own data with easy-to-use dashboards and event monitoring. But once you’ve identified areas that you’d like to improve, what do you do about it?
Our Other Tools Can Help, Too
The rest of the Pagos ecosystem can help! Our Action birds—Parrot, Toucan, and Loon—can help you better understand your customers, improve approval rates, and decrease costs.
Parrot, a better BIN service, provides the most comprehensive and up-to-date BIN data. You can incorporate BIN data via an API directly into your cards database. This will allow you to perform detailed customer analysis to better understand your customer segments and transactions data.
If you’re looking to directly influence approval rate, cost, and customer churn, Toucan and Loon are for you. Toucan is a processor independent, network agnostic network tokenization service. Network tokenization has been shown to improve approval rates by at least 2.5% and reduce interchange up to 10 basis points in the US and other select markets. Loon is a processor independent, network agnostic global account updater solution; using an account updater solution will not only improve approval rates, but also reduce customer churn—particularly with vaulted credentials.
If you’ve been keeping up with the Pagos flock, you know that the information available in Peacock and Canary grows every day. If you’re not sure where to begin, that’s okay! Transaction data is sometimes confusing and overwhelming, and we’re here to help make sense of it all.
Payments are a great indicator of the health of any business. If your job deals with payments operations, risk and fraud, customer experience, or finance, you have something to gain by paying attention to payments performance. And in the modern world we’re living in, being more data-driven in your decision making is always a good idea. Let’s take a look at how Peacock can benefit your team.
Payments Operations
An easy place to start is within Payments Operations teams themselves. If you’re on a Payments Ops team, you have a lot to gain from the immediate visualization of the Peacock dashboards. Some of the key details you’d want to monitor are displayed every time you log in on the Home dashboard.
At Pagos, we think of the Home dashboard as a health check of your payments operations. Here, you’ll find key metrics like average order value (AOV), transaction volume, and chargeback rate. With these metrics, you can track not only the health of the business, but the performance of payments operations before and after authorization.
As a payments operations professional, you might check turnover, AOV, and approval rates to make sure that those key performance indicators look as expected. If nothing is out of place, you may want to dig deeper using the chart library within the Peacock Standard dashboards. Standard dashboards break out the transaction lifecycle—from transaction through settlement—into individual dashboards and charts. The Processor dashboard, for example, breaks out payments data by processor and can help answer questions like "Where in my payment stack are there incomplete sales?“ or “Is my transaction volume trending in the right direction?”
When evaluating or comparing processor performance, we recommend looking beyond transaction share or approval rates. If everything looks fine at the surface, other views of data might show you which part of your payments stack is suboptimal. You may find answers within processor decline codes. An easy and addressable place to start is any error-based decline. For example, a spike in decline_gateway could indicate a bug in your gateway integration, or a spike in refer_to_issuer with your European processor might mean that you have authentication or 3DS errors due to an integration. Both issues may be remediated with your development team.
If you think you’ve addressed any integration issues with your development team, you might want to track the transaction count of those specific decline codes by configuring a trigger in Canary. That way, you’ll know if you successfully remediated the issue.
If you’re looking for more cost risk in your business—or are on a Risk and Fraud team—you may want to pay more attention to the refunds and chargeback dashboards.
Risk and Fraud
If you’re on a Risk and Fraud team, you’re likely paying the most attention to chargeback and refund activity. Peacock comes equipped with pre-made and immediately populated dashboards for both!
On the Chargebacks dashboard, you can answer questions like:
“Is my chargeback volume due to fraud or operations?”,
“What BINs are being targeted for fraud?”
“How many chargeback cases do we win?”
For the first question, a great way to understand where chargebacks come from is by filtering a whole dashboard by card type. Card type (e.g., credit, debit, prepaid) can approximate large customer segments; if you find a disproportionate number of chargebacks come from a card type that’s unusual to your business, it’s worth investigating potential fraud.
If you want to conduct more granular analysis, look at the BIN data, specifically the Top 25 Chargebacks by BINs chart in the Chargebacks dashboard. Sometimes bad actors will target particular BINs for chargeback schemes.
If you find any suspicious BIN activity, you can monitor the chargeback rate by BIN in Canary. Instead of checking back every day, let Canary do the monitoring for you! It will let you know whenever a change is enough to warrant your attention.
You’ll find similar dissections of data within the Refunds dashboards. There, you can see overall refund volume and refunds by BIN. You can, of course, always filter any of the dashboards by any data attribute most meaningful to your business.
So far, we’ve talked about potential costs and risks to your business. What about growth?
Payments Product Development, Payments Partnerships, and Checkout Customer Experience
If you’re on a team that focuses on payment product development, partnerships, and customer experience, you may be trying to answer questions like, “Which payment methods and card types are successfully making it through checkout?”
To answer this question, you could start in Peacock’s Card Type dashboard or Payment Method dashboard. In these dashboards, you can look at the distribution transactions, approvals, and declines by card types and by payment method. As mentioned above, card type can be a good approximation of your customer segments; by looking specifically at approval volume and decline rates, you can tell which customers aren’t making it through checkout. If you’re not capturing customer segments you want, or if your checkout is blocking customers you don’t want blocked, you need to make adjustments to your customer experience.
In Canary, you can configure triggers for approval rate and decline rate by card types. That way, you’ll receive notifications when you attract or lose the card types—and customers—you want.
When payments growth is on your mind, you may be looking to compare processors. A great time to look at processor comparison is when you’re onboarding a new payments processor. In this scenario, you can track the approval rate of your new processor as volume increases; if it’s not meeting the benchmarked standard of prior performance, first start by comparing the transaction volume and transaction messaging you're sending to both processors. Before you contact your new processor’s account management team, make sure that each processor is getting the exact same information–then you can truly isolate performance.
Finance
If you’re on a Finance team, you’ll likely start by using Peacock to trace high-level trends over time. On the revenue side, you’ll want to understand the health of your sales. Turnover, AOV, and the distribution of stored credentials can tell you whether your sales are consistent over time and if your subscription business is healthy. To conduct this analysis, review the Turnover and Average Order Value chart in the Home dashboard, or filter any chart on any dashboard by Stored Credential.
With Canary, you can monitor the health of your sales over time by setting up Transaction Counts and AOV triggers. That way, if your business experiences a decrease in transaction volume, you’ll know right away.
On the cost side of the business, we recommend keeping an eye on your card type, payment method, and card brand mixes, as these are going to be your biggest drivers of interchange. If you filter Peacock charts and dashboards with the Card Brand filter and notice a shift to more premium cards, for example, you can expect that your payments costs are going to go up. It might be worth connecting with your marketing team to see if the acquisition of that customer segment was intentional and will outweigh the future cost.
If things don’t look quite right on the top level and you’re a marketplace business, your next step might be to look at your submerchant performance to see who is driving the most revenue and cost. You can bring submerchant data into Peacock through the soft descriptor filter.
Any team can benefit from Peacock and Canary. They allow you to access the power of your own data with easy-to-use dashboards and event monitoring. But once you’ve identified areas that you’d like to improve, what do you do about it?
Our Other Tools Can Help, Too
The rest of the Pagos ecosystem can help! Our Action birds—Parrot, Toucan, and Loon—can help you better understand your customers, improve approval rates, and decrease costs.
Parrot, a better BIN service, provides the most comprehensive and up-to-date BIN data. You can incorporate BIN data via an API directly into your cards database. This will allow you to perform detailed customer analysis to better understand your customer segments and transactions data.
If you’re looking to directly influence approval rate, cost, and customer churn, Toucan and Loon are for you. Toucan is a processor independent, network agnostic network tokenization service. Network tokenization has been shown to improve approval rates by at least 2.5% and reduce interchange up to 10 basis points in the US and other select markets. Loon is a processor independent, network agnostic global account updater solution; using an account updater solution will not only improve approval rates, but also reduce customer churn—particularly with vaulted credentials.
Share this Blog Post
Share this Blog Post
Latest Blog Posts
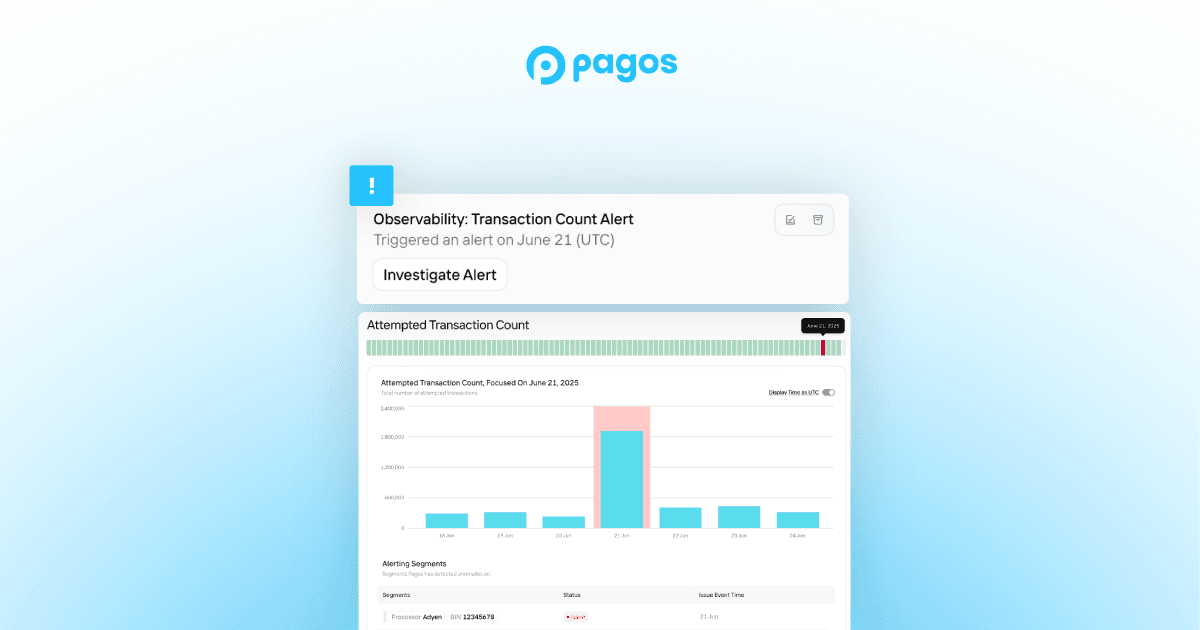
Catching Spikes Before They Burn You: Monitoring BINs to Stay Ahead of Carding Attacks
Catching Spikes Before They Burn You: Monitoring BINs to Stay Ahead of Carding Attacks
Catching Spikes Before They Burn You: Monitoring BINs to Stay Ahead of Carding Attacks

Boosting Pagos’ Engineering Capacity with AI
Boosting Pagos’ Engineering Capacity with AI
Boosting Pagos’ Engineering Capacity with AI
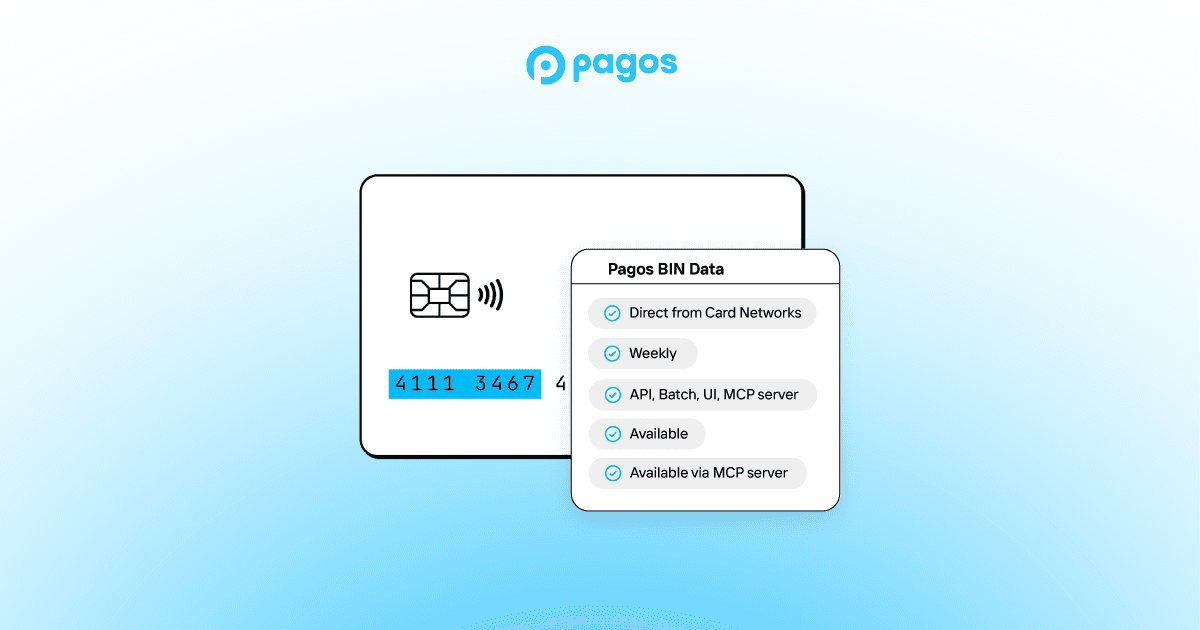
Pagos BIN Data: The Superior Choice for Smarter Payments
Pagos BIN Data: The Superior Choice for Smarter Payments
Pagos BIN Data: The Superior Choice for Smarter Payments
Subscribe to our Blog
Subscribe to
our Blog
Subscribe to our Blog
By submitting, you are providing your consent for future communication in accordance with the Pagos Privacy Policy.