Peacock
Combining Rate and Volume: Why Context Matters
September 22, 2022
September 22, 2022

Katie McCarthy
Katie McCarthy
Katie McCarthy
At Pagos, we understand that transaction data can be overwhelming. There are a thousand ways to segment and view the data. How do you know what’s important? How can you tell if a change in your data is a blip or a trend?
One way to keep your attention on what really matters is to consider transaction volume when looking at rates—such as approval rate or chargeback rate—or rates over time. Let’s take a look at an example.
Imagine you’re a US-based merchant with a sizable European cross-border business. You review your approval rates by issuing country week-over-week and notice there was a decrease in approval rate for cards issued in Italy from 78% to 61%. This appears to be a cause for concern, so you consider investigating your fraud rules; perhaps a recent change to your processor's fraud rules or your own have negatively affected Italian issuing banks? Before you contact the team, you decide to take a look at transaction volume to size the impact. Only then do you realize the total transaction volume for cards issued in Italy was only 312 transactions—this amounts to an additional 53 transactions that were declined this week. Considering your total European cross-border transaction count is 10,000 transactions per week, what you thought was a large issue, affects less than 0.01% of your total European business. This change in approval rate might not be a top priority for further investigation.
As you can see, the context of volume is very important when looking at changes in rate. Peacock by Pagos can help you focus on changes in your payment stack that matter by reducing the noise of low volume segments of data.
Removing Low Volume Data Points in Peacock
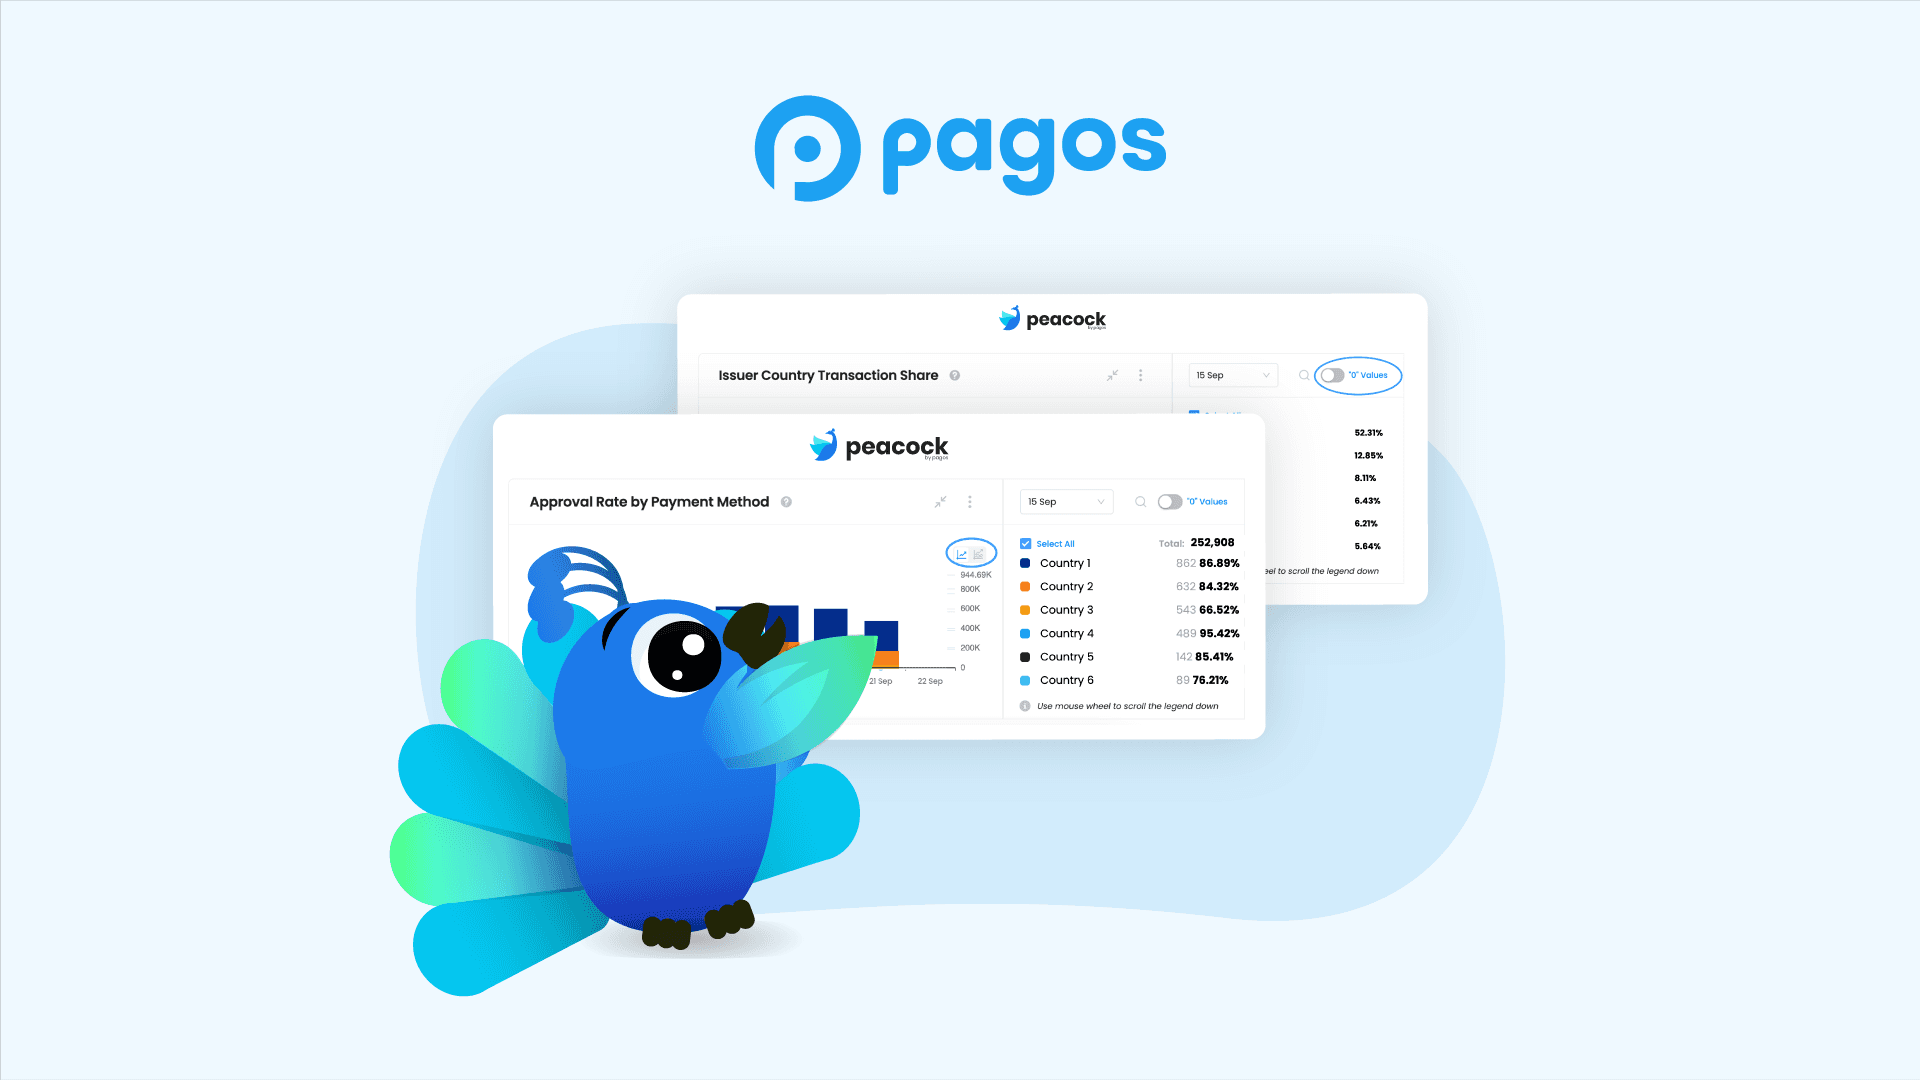
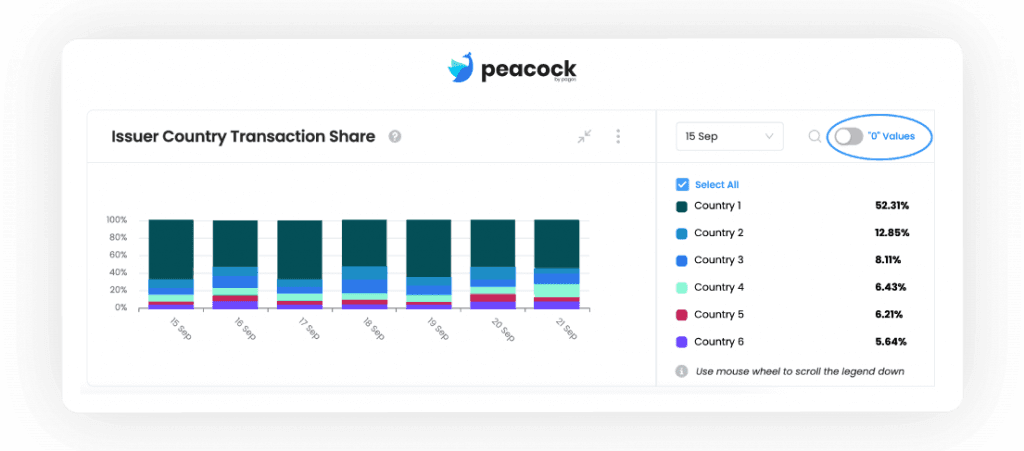
In Peacock, there are a couple of tools you can use to eliminate low volume data segments from your data visualizations. To start, every chart has a “0” value toggle at the top of the chart legend. You can use this toggle to show or hide any data segments from the chart for which there was zero transaction volume in the selected time period.
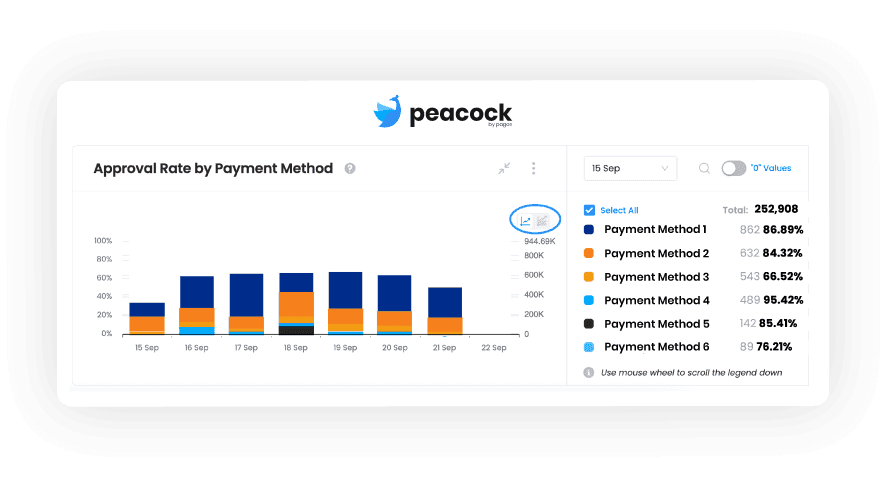
A few charts include a separate feature called the low value switcher. This switcher removes any data segments from the chart that make up less than a half percent of total volume. For example, if a chart shows your approved transaction count broken down by payment method and your total approved transaction count was 100,000, then clicking the low value switcher would remove any payment methods with less than 500 approved transactions from the chart.
You can use this feature on the Approval Rate by Payment Method, Approval Rate by Currency, and Issuer Country Approval Rate charts; It’s located in the upper right corner of the chart area.
Both of these features help eliminate noise on your Peacock dashboards. By removing segments of your data with no or low volume, you’re able to focus on segments that have material impact on your payments operations.
Keeping Authorization Context When Analyzing Issuing Bank Decline Codes
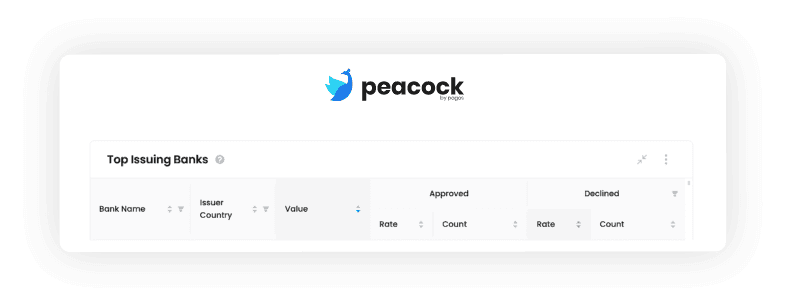
Sometimes it’s helpful to view rate in relation to volume, rather than removing low volume data segments all together. For this, we have introduced a new type of filter to the Top Issuing Banks table in the Issuing Bank dashboard. This chart lists the top banks that issued the cards you processed in the set time period by transaction count; in addition to volume, however, it also includes values for approval rate and count and decline rate and count for each issuing bank. In the decline rate columns, you can filter the decline rate by individual decline codes without affecting any other columns in the chart.
This allows you to investigate the share of declines by transaction response code while maintaining the context of how much volume the issuing bank contributes to your total transaction volume. By holding the volume and approval constant, you always can tell whether or not the share of decline code is an opportunity big enough to pursue or investigate further.
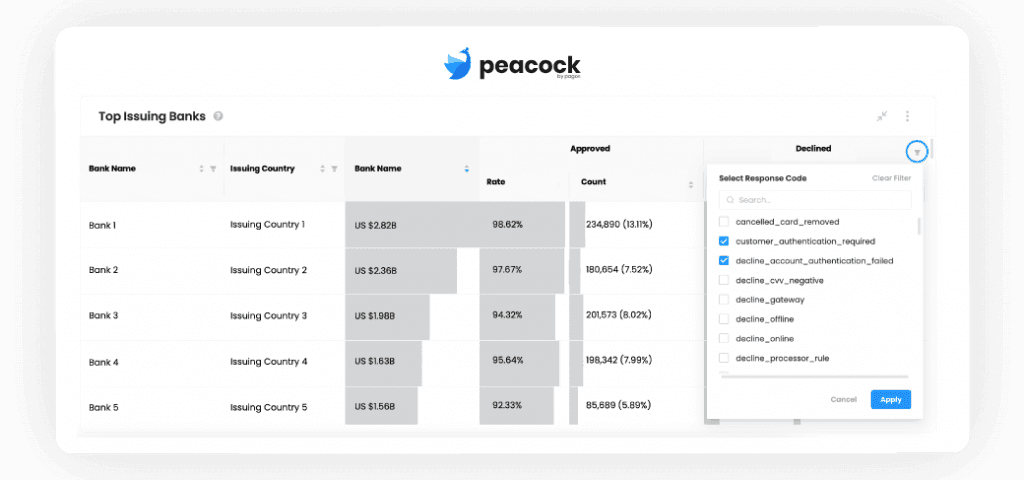
Different decline codes can impact the cost and performance of your payments stack. For example, decline codes that indicate technical errors could lead you to contact your payments partner or your engineering team to address an integration issue. Before you begin engaging multiple parties, it’s always good to know how big of an issue you’re trying to address. This not only helps you better understand your business context, but also supports internal prioritization efforts.
Want to Keep Exploring?
Peacock not only provides you with visualizations of your payments data, it also has the tools you need to contextualize that data. Ready to get started?
At Pagos, we understand that transaction data can be overwhelming. There are a thousand ways to segment and view the data. How do you know what’s important? How can you tell if a change in your data is a blip or a trend?
One way to keep your attention on what really matters is to consider transaction volume when looking at rates—such as approval rate or chargeback rate—or rates over time. Let’s take a look at an example.
Imagine you’re a US-based merchant with a sizable European cross-border business. You review your approval rates by issuing country week-over-week and notice there was a decrease in approval rate for cards issued in Italy from 78% to 61%. This appears to be a cause for concern, so you consider investigating your fraud rules; perhaps a recent change to your processor's fraud rules or your own have negatively affected Italian issuing banks? Before you contact the team, you decide to take a look at transaction volume to size the impact. Only then do you realize the total transaction volume for cards issued in Italy was only 312 transactions—this amounts to an additional 53 transactions that were declined this week. Considering your total European cross-border transaction count is 10,000 transactions per week, what you thought was a large issue, affects less than 0.01% of your total European business. This change in approval rate might not be a top priority for further investigation.
As you can see, the context of volume is very important when looking at changes in rate. Peacock by Pagos can help you focus on changes in your payment stack that matter by reducing the noise of low volume segments of data.
Removing Low Volume Data Points in Peacock
In Peacock, there are a couple of tools you can use to eliminate low volume data segments from your data visualizations. To start, every chart has a “0” value toggle at the top of the chart legend. You can use this toggle to show or hide any data segments from the chart for which there was zero transaction volume in the selected time period.
A few charts include a separate feature called the low value switcher. This switcher removes any data segments from the chart that make up less than a half percent of total volume. For example, if a chart shows your approved transaction count broken down by payment method and your total approved transaction count was 100,000, then clicking the low value switcher would remove any payment methods with less than 500 approved transactions from the chart.
You can use this feature on the Approval Rate by Payment Method, Approval Rate by Currency, and Issuer Country Approval Rate charts; It’s located in the upper right corner of the chart area.
Both of these features help eliminate noise on your Peacock dashboards. By removing segments of your data with no or low volume, you’re able to focus on segments that have material impact on your payments operations.
Keeping Authorization Context When Analyzing Issuing Bank Decline Codes
Sometimes it’s helpful to view rate in relation to volume, rather than removing low volume data segments all together. For this, we have introduced a new type of filter to the Top Issuing Banks table in the Issuing Bank dashboard. This chart lists the top banks that issued the cards you processed in the set time period by transaction count; in addition to volume, however, it also includes values for approval rate and count and decline rate and count for each issuing bank. In the decline rate columns, you can filter the decline rate by individual decline codes without affecting any other columns in the chart.
This allows you to investigate the share of declines by transaction response code while maintaining the context of how much volume the issuing bank contributes to your total transaction volume. By holding the volume and approval constant, you always can tell whether or not the share of decline code is an opportunity big enough to pursue or investigate further.
Different decline codes can impact the cost and performance of your payments stack. For example, decline codes that indicate technical errors could lead you to contact your payments partner or your engineering team to address an integration issue. Before you begin engaging multiple parties, it’s always good to know how big of an issue you’re trying to address. This not only helps you better understand your business context, but also supports internal prioritization efforts.
Want to Keep Exploring?
Peacock not only provides you with visualizations of your payments data, it also has the tools you need to contextualize that data. Ready to get started?
Share this Blog Post
Share this Blog Post
Latest Blog Posts
Catching Spikes Before They Burn You: Monitoring BINs to Stay Ahead of Carding Attacks
Catching Spikes Before They Burn You: Monitoring BINs to Stay Ahead of Carding Attacks
Catching Spikes Before They Burn You: Monitoring BINs to Stay Ahead of Carding Attacks

Boosting Pagos’ Engineering Capacity with AI
Boosting Pagos’ Engineering Capacity with AI
Boosting Pagos’ Engineering Capacity with AI
Pagos BIN Data: The Superior Choice for Smarter Payments
Pagos BIN Data: The Superior Choice for Smarter Payments
Pagos BIN Data: The Superior Choice for Smarter Payments
Subscribe to our Blog
Subscribe to
our Blog
Subscribe to our Blog
By submitting, you are providing your consent for future communication in accordance with the Pagos Privacy Policy.