Products
How to Use BIN Segmentation in Peacock and Canary
September 15, 2022
September 15, 2022

Katie McCarthy
Katie McCarthy
Katie McCarthy

Every card your customers use to make purchases from your business includes a bank identification number (BIN). These BINs are far more than just the first 6-8 digits of the primary account number (PAN) on those cards: they’re invaluable pockets of data about the cards in question and the customers they belong to. When you know a card’s BIN, you know which bank issued it and in which country, what type of card it is, whether it’s a traditional or business card, and more!
Analyzing BIN data by key payments metrics allows you to identify performance challenges with particular customer segments or issuing banks. By addressing any issues that may come up—like BINs with excessive chargebacks— you can improve your relationship with issuing banks and reduce your company’s risk profile.
You can see BIN data in both Peacock and Canary by Pagos. Let’s take a look at how the functionality works and how to make the most of BIN data within Pagos.
BINs in Peacock: Understanding Total Transaction Counts and Chargebacks
There are two places where you can find BIN details in Peacock: the Issuing Bank dashboard and the Chargebacks dashboard. In both dashboards, you’ll find a list of the top 25 BINs by transaction count or by chargeback rate, along with their respective values.
Here is an example of the Top 25 BINs by Transaction Count chart:
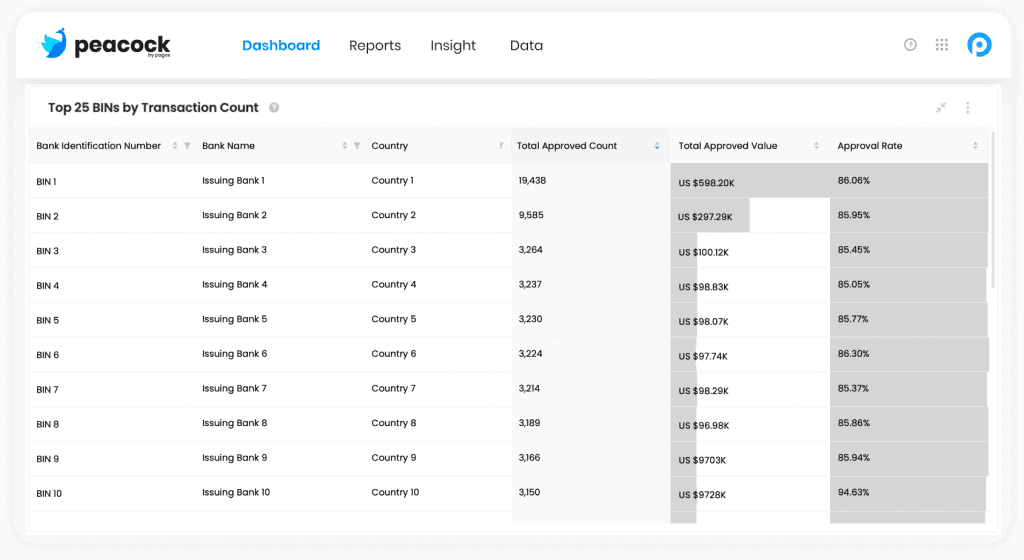
This chart helps you understand your issuers and your customers. Using this chart, you can identify which BINs contribute the most to your transaction volume, as well as their corresponding issuing banks. You’ll want to keep an eye on these BINs and issuing banks, as their approval rate performance will have an outsized impact on your overall payment ecosystem’s performance.
The same is true for the Top 25 BINs by Chargeback Volume. BINs that contribute the most to your chargeback volume are good to monitor. They could represent customer segments or issuing banks that have high rates of fraudulent activity, or might help you pinpoint an issue in your checkout flow that only impacts said customer segment.
So, now you’ve used your Peacock dashboards to identify BINs and issuing banks that you want to monitor. What do you do next? Is that another Pagos bird you see on the horizon? Perhaps it’s a Canary…
BINs in Canary: Proactive Monitoring of Key Metrics by BIN
In Canary, you have always been able to configure triggers to monitor key metrics (e.g. approval rate, transaction count, chargeback rate, etc.) by issuing bank. Now, you can monitor and receive alerts for anomalies in those same metrics for specific BINs, as well.
Let’s say that you’ve identified your highest three BINs from the Top 25 BINs by Transaction Count chart. You want to monitor the approval rate in those BINs, so that if anything happens, you can take action immediately in response. Such actions could include adjusting your fraud rules, tweaking your UI, or even exploring issues with your logistics or fulfillment centers.
Here is how you would set up a helpful trigger for this scenario in Canary. First, you’d select Approval Rate for your trigger Metric, and then choose whether you want a simple or relative threshold for the trigger. Next, set the Direction for the trigger and the Threshold value (simple thresholds only). Now comes the fun part: setting up trigger filters. To receive alerts only for those three BINs we talked about above, choose the following settings:
Filter: BIN
Filter parameters: Choose the three BINs that you’ve identified from the drop down menu. The maximum number of BINs you can monitor in one filter is twelve
Do you want to have your Canary triggers keep track of the Issuing Bank for you, as well? Simply configure your trigger filters like this:
Filter 1: Issuing Bank
Filter 1 parameters: The Issuing Banks associated with your BINs, as provided by the Peacock chart
Filter 2: BIN
Filter 2 parameters: The three BINs you want to monitor
This is a perfect example of how to powerfully combine both Peacock and Canary. Once you’ve explored Peacock and learned what segments of your data are important to keep an eye on, you can configure Canary to monitor those segments for you. This means that you can detect meaningful changes in those valuable segments of your business faster, which in turn allows you to mitigate losses or improve the experience of important revenue streams.
Get Started With Pagos
Are you ready to improve customer and business outcomes? Sign up for Canary
Every card your customers use to make purchases from your business includes a bank identification number (BIN). These BINs are far more than just the first 6-8 digits of the primary account number (PAN) on those cards: they’re invaluable pockets of data about the cards in question and the customers they belong to. When you know a card’s BIN, you know which bank issued it and in which country, what type of card it is, whether it’s a traditional or business card, and more!
Analyzing BIN data by key payments metrics allows you to identify performance challenges with particular customer segments or issuing banks. By addressing any issues that may come up—like BINs with excessive chargebacks— you can improve your relationship with issuing banks and reduce your company’s risk profile.
You can see BIN data in both Peacock and Canary by Pagos. Let’s take a look at how the functionality works and how to make the most of BIN data within Pagos.
BINs in Peacock: Understanding Total Transaction Counts and Chargebacks
There are two places where you can find BIN details in Peacock: the Issuing Bank dashboard and the Chargebacks dashboard. In both dashboards, you’ll find a list of the top 25 BINs by transaction count or by chargeback rate, along with their respective values.
Here is an example of the Top 25 BINs by Transaction Count chart:
This chart helps you understand your issuers and your customers. Using this chart, you can identify which BINs contribute the most to your transaction volume, as well as their corresponding issuing banks. You’ll want to keep an eye on these BINs and issuing banks, as their approval rate performance will have an outsized impact on your overall payment ecosystem’s performance.
The same is true for the Top 25 BINs by Chargeback Volume. BINs that contribute the most to your chargeback volume are good to monitor. They could represent customer segments or issuing banks that have high rates of fraudulent activity, or might help you pinpoint an issue in your checkout flow that only impacts said customer segment.
So, now you’ve used your Peacock dashboards to identify BINs and issuing banks that you want to monitor. What do you do next? Is that another Pagos bird you see on the horizon? Perhaps it’s a Canary…
BINs in Canary: Proactive Monitoring of Key Metrics by BIN
In Canary, you have always been able to configure triggers to monitor key metrics (e.g. approval rate, transaction count, chargeback rate, etc.) by issuing bank. Now, you can monitor and receive alerts for anomalies in those same metrics for specific BINs, as well.
Let’s say that you’ve identified your highest three BINs from the Top 25 BINs by Transaction Count chart. You want to monitor the approval rate in those BINs, so that if anything happens, you can take action immediately in response. Such actions could include adjusting your fraud rules, tweaking your UI, or even exploring issues with your logistics or fulfillment centers.
Here is how you would set up a helpful trigger for this scenario in Canary. First, you’d select Approval Rate for your trigger Metric, and then choose whether you want a simple or relative threshold for the trigger. Next, set the Direction for the trigger and the Threshold value (simple thresholds only). Now comes the fun part: setting up trigger filters. To receive alerts only for those three BINs we talked about above, choose the following settings:
Filter: BIN
Filter parameters: Choose the three BINs that you’ve identified from the drop down menu. The maximum number of BINs you can monitor in one filter is twelve
Do you want to have your Canary triggers keep track of the Issuing Bank for you, as well? Simply configure your trigger filters like this:
Filter 1: Issuing Bank
Filter 1 parameters: The Issuing Banks associated with your BINs, as provided by the Peacock chart
Filter 2: BIN
Filter 2 parameters: The three BINs you want to monitor
This is a perfect example of how to powerfully combine both Peacock and Canary. Once you’ve explored Peacock and learned what segments of your data are important to keep an eye on, you can configure Canary to monitor those segments for you. This means that you can detect meaningful changes in those valuable segments of your business faster, which in turn allows you to mitigate losses or improve the experience of important revenue streams.
Get Started With Pagos
Are you ready to improve customer and business outcomes? Sign up for Canary
Share this Blog Post
Share this Blog Post
Latest Blog Posts
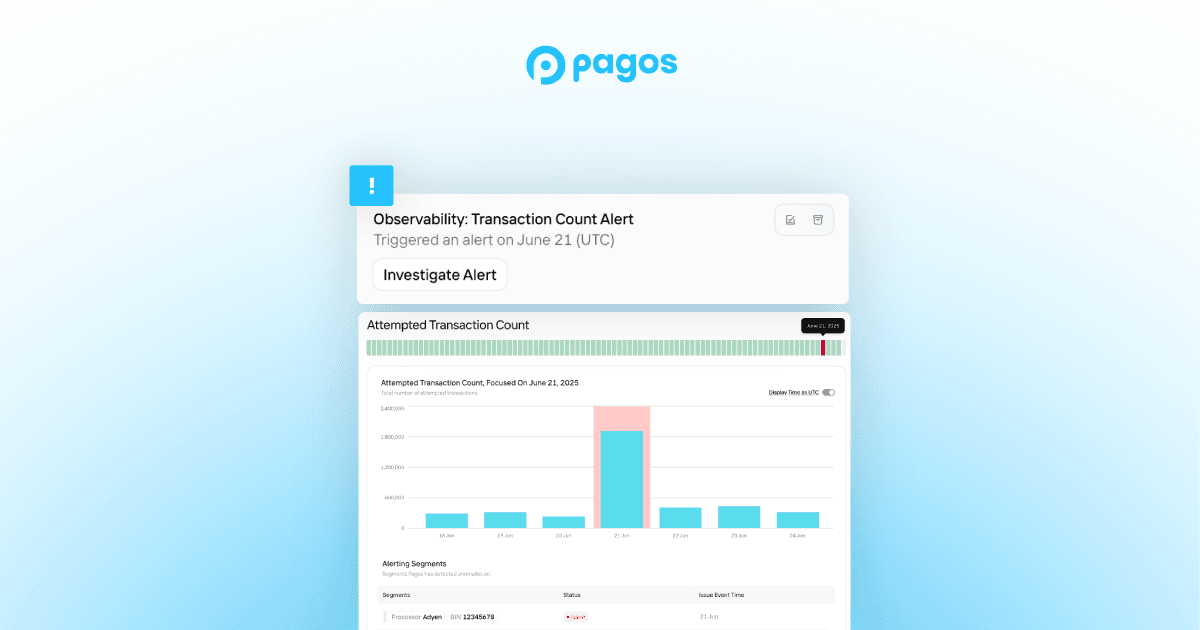
Catching Spikes Before They Burn You: Monitoring BINs to Stay Ahead of Carding Attacks
Catching Spikes Before They Burn You: Monitoring BINs to Stay Ahead of Carding Attacks
Catching Spikes Before They Burn You: Monitoring BINs to Stay Ahead of Carding Attacks

Boosting Pagos’ Engineering Capacity with AI
Boosting Pagos’ Engineering Capacity with AI
Boosting Pagos’ Engineering Capacity with AI
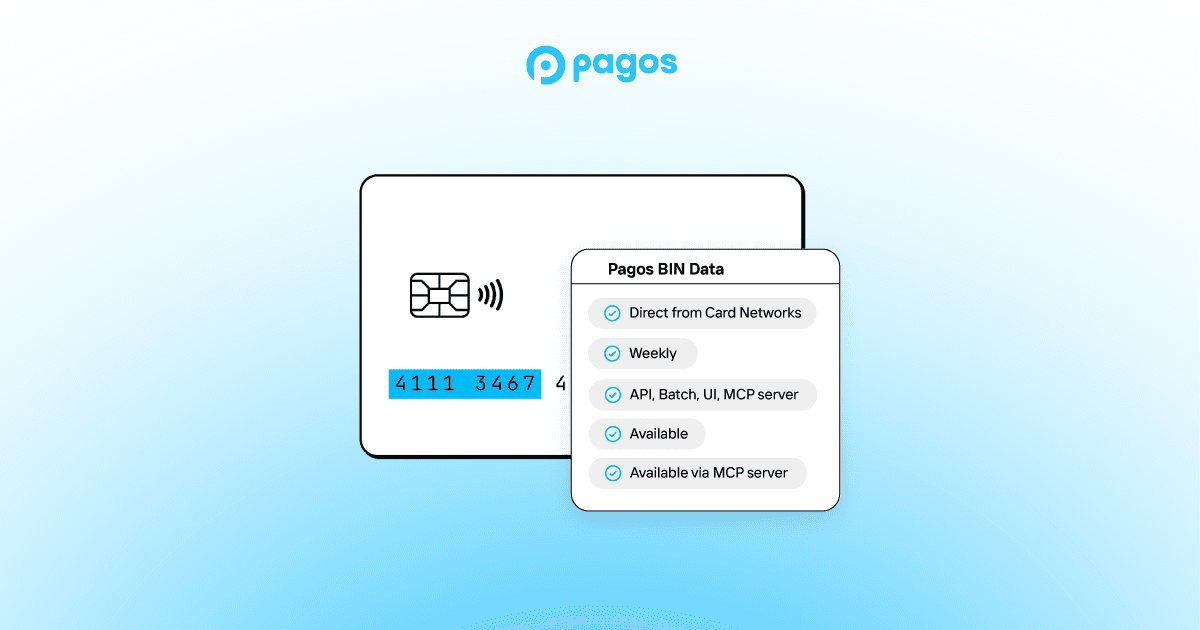
Pagos BIN Data: The Superior Choice for Smarter Payments
Pagos BIN Data: The Superior Choice for Smarter Payments
Pagos BIN Data: The Superior Choice for Smarter Payments
Subscribe to our Blog
Subscribe to
our Blog
Subscribe to our Blog
By submitting, you are providing your consent for future communication in accordance with the Pagos Privacy Policy.