

Company
The Pagos Query Language
June 9, 2022
June 9, 2022

Otto Barnes
Otto Barnes
Otto Barnes

Good engineering and great product design is all about managing complexity with the goal of encapsulating effectively and working as simply as possible. When it comes to managing the complexity of payment processing and transactional data, the industry has thus far left that entirely up to individual merchants. But merchants often don't have the experience or time that engineers do to efficiently sort through and simplify the complexities of payments data. Pagos is here to change that.
Exploring Your Data with Peacock and Canary
A transaction stream holds a lot of information and quite a bit of complexity. In general, the nuances matter and categorically a single two-dimensional view, like a bar chart or x-y plot, doesn’t cut the mustard anymore. Drilling down into the minute perturbations of your entire payment processing history requires data aggregation across processors and filtering down to specific subsets of that data. In the The ABCs of Peacock Dashboards and Filters, we discussed how Peacock by Pagos enables the user to dig into their data visually. These filters— as described in the web UI—seamlessly aggregate and filter data on the backend, providing Pagos users with a kaleidoscope of charts to capture the finer details of their transactional data.
Once you make a chart or custom dashboard of charts in Peacock, you can monitor it by logging into the Peacock service panel at a regular cadence. But what if you’d rather not have to stare at it every morning with a cup of coffee or tea? Could you have Pagos alert you to anomalies in that chart? You sure can! Canary is our data anomaly detection service that allows you to set thresholds and identify unexpected changes that might just be canaries in the coal mine. Here is an example of setting a manual threshold of 60% against approval rate in synthetic data using Canary:

Introducing the Pagos Query Language
While we’ve designed our microservices to function independently of one another, each one is built using similar structures. As such, the data charting in Peacock and the data triggers in Canary all require the same terms, the same fidelity, and the same language. With this in mind, we’re introducing the first version of that language that is in a Fluent Interface or style. Rather than have a JSON object with all those curly braces or a rich XML dialect, we have opted for something a bit more readable. We call it the Pagos Query Language, or PQL for short. Here’s how it looks in practice:
PQL#1# stream='pagos.ai' start='2022-06-03 00:00:00' end='2022-06-10 00:00:00' over='rolling days' metrics=[approval_rate] group_by=[ processor ]
In this example, we are looking at our synthetic transactional data stream from the last week over rolling days (rather than hours) and extracting the Approval Rate metric, aggregated by processor. This data stream includes transactions processed through both Processor A and Processor B, so the resulting Peacock chart or Canary trigger will have two time-series outputs. It doesn’t take a data scientist to tell you the actual query run behind the scenes isn’t that simple—it’s actually about a page of SQL and may or may not involve multiple systems for retrieval—but we’ve removed the complexity from the user’s plate.
But what if we want to focus on debit cards that have transactions in US dollars? Well that isn’t too difficult, it just requires a small tweak to the PQL:
What This Means For You
Could we look at data collected just today over a few hours instead? Or switch to a different metric during the same time period? It goes on and on from here but I think you get the idea. We now have a language that is really the nuts and bolts of our charts in Peacock and our triggers in Canary. It’s concise enough to share in an email or Slack too. Now, we can communicate simply and effectively about your data!
At the time of publication, PQL is something we’re only using internally, behind the scenes. In a future release, we hope to simplify and augment our filtering options by bringing PQL to our client-facing products. Stay tuned to the Pagos Blog for announcements down the line on how to access PQL directly from each of Pagos’ products.
In the meantime, head over to the Pagos Product Documentation to learn more about applying data filters in the Peacock service panel!
Good engineering and great product design is all about managing complexity with the goal of encapsulating effectively and working as simply as possible. When it comes to managing the complexity of payment processing and transactional data, the industry has thus far left that entirely up to individual merchants. But merchants often don't have the experience or time that engineers do to efficiently sort through and simplify the complexities of payments data. Pagos is here to change that.
Exploring Your Data with Peacock and Canary
A transaction stream holds a lot of information and quite a bit of complexity. In general, the nuances matter and categorically a single two-dimensional view, like a bar chart or x-y plot, doesn’t cut the mustard anymore. Drilling down into the minute perturbations of your entire payment processing history requires data aggregation across processors and filtering down to specific subsets of that data. In the The ABCs of Peacock Dashboards and Filters, we discussed how Peacock by Pagos enables the user to dig into their data visually. These filters— as described in the web UI—seamlessly aggregate and filter data on the backend, providing Pagos users with a kaleidoscope of charts to capture the finer details of their transactional data.
Once you make a chart or custom dashboard of charts in Peacock, you can monitor it by logging into the Peacock service panel at a regular cadence. But what if you’d rather not have to stare at it every morning with a cup of coffee or tea? Could you have Pagos alert you to anomalies in that chart? You sure can! Canary is our data anomaly detection service that allows you to set thresholds and identify unexpected changes that might just be canaries in the coal mine. Here is an example of setting a manual threshold of 60% against approval rate in synthetic data using Canary:
Introducing the Pagos Query Language
While we’ve designed our microservices to function independently of one another, each one is built using similar structures. As such, the data charting in Peacock and the data triggers in Canary all require the same terms, the same fidelity, and the same language. With this in mind, we’re introducing the first version of that language that is in a Fluent Interface or style. Rather than have a JSON object with all those curly braces or a rich XML dialect, we have opted for something a bit more readable. We call it the Pagos Query Language, or PQL for short. Here’s how it looks in practice:
PQL#1# stream='pagos.ai' start='2022-06-03 00:00:00' end='2022-06-10 00:00:00' over='rolling days' metrics=[approval_rate] group_by=[ processor ]
In this example, we are looking at our synthetic transactional data stream from the last week over rolling days (rather than hours) and extracting the Approval Rate metric, aggregated by processor. This data stream includes transactions processed through both Processor A and Processor B, so the resulting Peacock chart or Canary trigger will have two time-series outputs. It doesn’t take a data scientist to tell you the actual query run behind the scenes isn’t that simple—it’s actually about a page of SQL and may or may not involve multiple systems for retrieval—but we’ve removed the complexity from the user’s plate.
But what if we want to focus on debit cards that have transactions in US dollars? Well that isn’t too difficult, it just requires a small tweak to the PQL:
What This Means For You
Could we look at data collected just today over a few hours instead? Or switch to a different metric during the same time period? It goes on and on from here but I think you get the idea. We now have a language that is really the nuts and bolts of our charts in Peacock and our triggers in Canary. It’s concise enough to share in an email or Slack too. Now, we can communicate simply and effectively about your data!
At the time of publication, PQL is something we’re only using internally, behind the scenes. In a future release, we hope to simplify and augment our filtering options by bringing PQL to our client-facing products. Stay tuned to the Pagos Blog for announcements down the line on how to access PQL directly from each of Pagos’ products.
In the meantime, head over to the Pagos Product Documentation to learn more about applying data filters in the Peacock service panel!
Share this Blog Post
Share this Blog Post
Latest Blog Posts
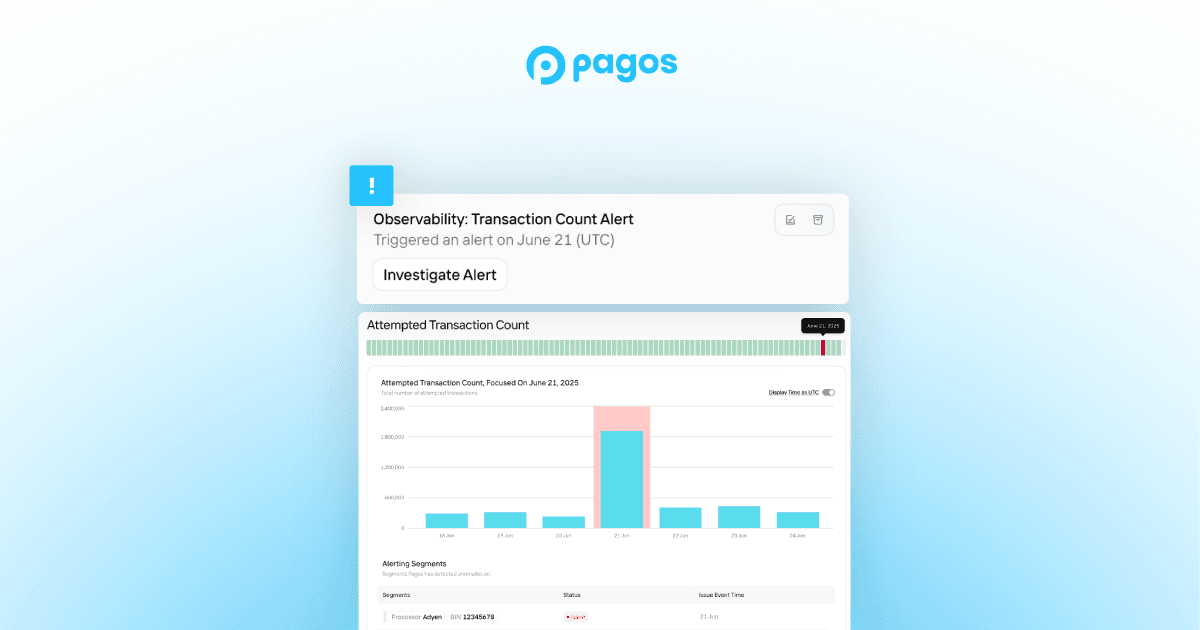
Catching Spikes Before They Burn You: Monitoring BINs to Stay Ahead of Carding Attacks
Catching Spikes Before They Burn You: Monitoring BINs to Stay Ahead of Carding Attacks
Catching Spikes Before They Burn You: Monitoring BINs to Stay Ahead of Carding Attacks

Boosting Pagos’ Engineering Capacity with AI
Boosting Pagos’ Engineering Capacity with AI
Boosting Pagos’ Engineering Capacity with AI
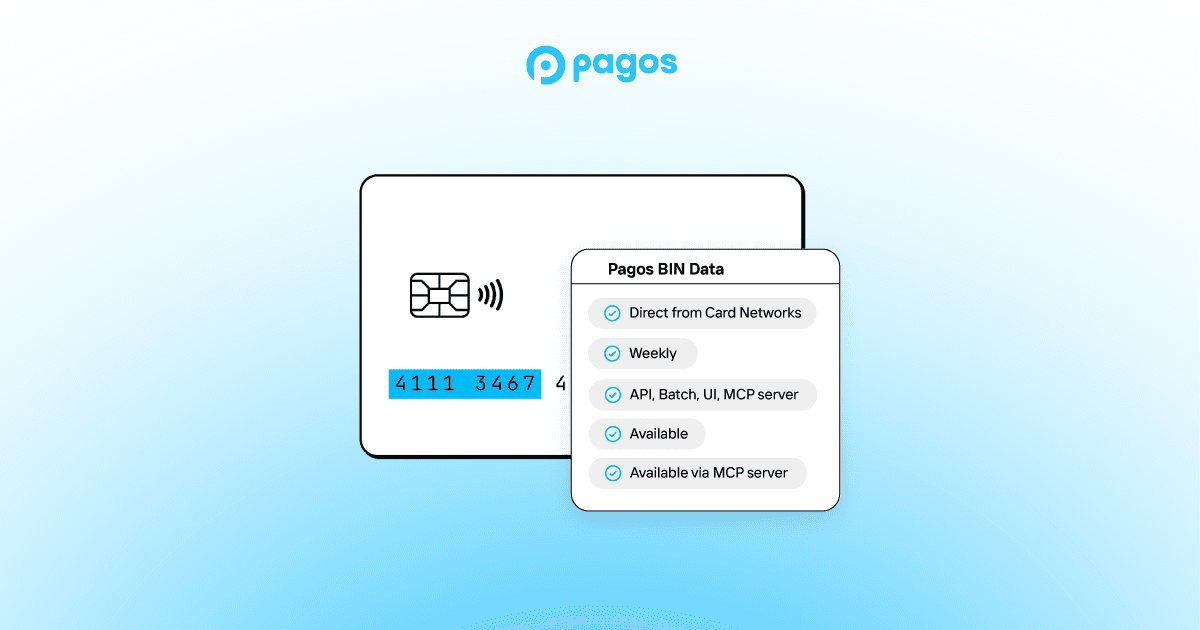
Pagos BIN Data: The Superior Choice for Smarter Payments
Pagos BIN Data: The Superior Choice for Smarter Payments
Pagos BIN Data: The Superior Choice for Smarter Payments
Subscribe to our Blog
Subscribe to
our Blog
Subscribe to our Blog
By submitting, you are providing your consent for future communication in accordance with the Pagos Privacy Policy.