

Peacock
Introducing Peacock by Pagos: Building a Path to Optimization
September 13, 2021
September 13, 2021

Albert Drouart
Albert Drouart
Albert Drouart

At Pagos we know that growing revenue and managing operations are really important to all companies. We’re passionate about aligning payments workflow and strategy with revenue and business goals through better understanding, tracking, and analysis.
Is payments optimization about doing better with your checkout, your mobile user experience, or your transaction processing?
How does a company know which might drive the biggest improvements?
Where to start?
If you are like us you’ve noticed that a lot of companies in the payments industry talk about optimization, but it isn’t always clear what is behind the marketing language or how it might apply to you. To illustrate with a few examples: Chase Paymentech provides a guide outlining 9 ways to improve Authorization Performance, Stripe speaks about increasing Twilio’s Authorization rate by 10%, while Braintree/PayPal highlights that one of the 3 ways to prevent revenue loss is to classify declines.
It is often very hard to know if the opportunities mentioned in blog posts and articles above really apply to you, so let’s dig into how Pagos can help.
At the end of many customer shopping journeys is a transaction; those transactions represent the intent of a customer to buy your product or service and cement a relationship that ideally will deliver revenue to your business over time. Transactions are where this customer intent and associated order are translated into something the “machines” and “pipes” of the payment industry can understand and act on: to authenticate, authorize, and ultimately move money. The payments industry has built up over the years, from early days where “online” didn’t exist and where money took days to move to now in making amazing experiences like Venmo or Uber possible. Understanding your transactions, within your business’ context, requires the right tools—the right lens—so that you can do what’s best for your company and your customers. That’s why we say it is a data + tools + expertise challenge, because only by combining these three things are you able to truly optimize and manage payments to help your business.
We are so excited to be building better tools and services to help you do what’s best for your business no matter which payment processing partners you use.

Peacock by Pagos makes aggregating, visualizing, and understanding your payment data easier than ever before. We provide a no-code—or low-code for additional flexibility—way to get your data into our platform, and a powerful visualization tool which allows you to see details about your orders, transactions, chargebacks, declines, and more with a few clicks. These are the first steps to identifying the opportunities in your own data to manage your business, establish better partnerships with your payment vendors, and grow your revenue.
There’s no better way to introduce Peacock than to dig into how it can help you identify opportunities or challenges that might be impacting your business. Let’s take three areas that are often discussed by payment processors and go into details about how these may appear in your own data.
First, let’s anchor our discussion in the one metric that every company should be looking at when it comes to payments: approval rate, or authorization rate. This is a simple metric, usually expressed as a percentage, which shows the total count of approved transactions divided by the total number of attempted transactions. We recommend you include all attempted transactions in the denominator of this metric because otherwise you risk missing technical errors that are blocking valid transactions.
Example: If you have 10 total transactions attempted, and 8 of those transactions are successful then your approval rate would be 80%. This means that two of those transactions represented customers who tried to buy but got turned away. Are you sure that was for all the right reasons, or could some of them have been successful if you had a different set up?
In Peacock, you can immediately see your overall approval rate along with a few other stats. It’ll look something like this:

Looking at the approval rate of your entire business over time is a great way to get a sense that everything is going well, but it is really hard to get a sense of whether there are addressable challenges or opportunities. Most payment processors in the market today will give you their view of how you are performing based on what they see of your business, and while they do include details on why transactions get declined, the details are usually locked away in the underlying data. This amounts to a lot of additional work for you to make sense of those details and drive your payments strategy. Peacock can help surface this information quickly and easily so you can identify opportunities and challenges. We’ll dig into examples of three good questions to ask of your data.
Which card types are not performing well?
Taking a line from the Chase article above, let’s break the approval rate up by card type: Chase notes “Identify the specific card types that negatively impact authorization rates.” Peacock makes finding this really easy: click on Reports in the top navigation and then click on Card Types to see your approval rate trends by card type. You’ll immediately see your payments data broken down by the major card networks (e.g. Visa, MasterCard, Amex, Discover, etc.) and payment types (e.g. credit card, debit card, prepaid card, etc.), including a view on the approval rates for different card types and their share of the volume. It will look something like:


In this example you can see that while you are achieving 90% overall approval rate, there is a big difference between the credit and debit cards. These types of differences are worth digging into and focusing attention on:
Why is debit not performing as well as credit?
Are they being processed or being used differently?
What type of declines am I seeing?
Going deeper, let’s take a look at what Stripe said in their customer story about Twilio. Stripe mentioned they enabled Account Updater for Twilio and saw a 1.5% improvement in the Approval Rate. Is this an opportunity for you? The first step in figuring this out is breaking down your declines by the detailed reason codes. Identifying transactions that are failing due to expired cards will usually require work since most payment providers don’t provide this as a default view in their dashboards. With Peacock this is easy. Click on Reports > Decline Analysis and you’ll be able to view a breakdown of the reasons why your transactions were declined and where they are occurring. Here’s an example of how Peacock breaks out the overall distribution of your decline codes:

Some declines like expired_cards or lost_stolen and even do_not_honor can be indicators of opportunities for improvements in your payments workflow. Expired card declines are usually what we would consider an addressable decline. Why? When you see a decline due to insufficient funds, it is clear that the consumer may not be able to pay at this time. On the other hand, expired cards are NOT reflecting the consumers’ ability to pay, but rather a technicality related to their card: the details provided in the transaction are not up to date, and there are ways to address this. If you have the opportunity, you can ask for updated information from the consumer. Or if your business is trying to minimize all customer friction, you can consider using payment network tools like Account Updater to get new card details from issuing banks without involving the customer. Almost all networks provide Account Updater functionality. In many cases, using Account Updater can mitigate anywhere from 10% - 50% of total declines due to expired cards. What would this mean to you?
Where are my customers located?
Another really great lens to look at your approval rate data through is by your customers’ location. Braintree’s blog post about addressing the leading reasons for lost revenue correctly points out a key question “Are your customers based in the U.S.?” As we describe in our documentation, payment networks make it really easy for banks anywhere in the world to process payments, but each region has different rules and different approaches. Breaking your approval rate down by issuer country is a great way to explore the impact of customer locations on your approval rates, irrespective of what currencies you may be selling in. It can also give you guidance on how you may want to modify your customer experience: offering a new local currency, changing the information on the checkout page to be localized or tailored to the payment norms of the market, and—in some cases—changing the payment methods you offer. We’ve built a dashboard for this: click on Reports > Issuers and you’ll see details around the performance of payments in various markets.

As a general rule, the buyers that are closest to you will probably perform the best. Is this true in your data today? If not, this could be an area to research with your development team or payment processor.
In the coming weeks, we’ll share more about our products, vision, and how to use our tools to improve awareness of what’s happening in your payment environment. Pagos will make it easy for you to get the visibility and advice you need to optimize your payments performance.
No-code beta integration is now open to businesses using Braintree or Stripe, and our API is available for use with other processors. Register to join.
We also love hearing about optimization challenges; they help us understand what solutions are most valuable. Contact us and share your story!
At Pagos we know that growing revenue and managing operations are really important to all companies. We’re passionate about aligning payments workflow and strategy with revenue and business goals through better understanding, tracking, and analysis.
Is payments optimization about doing better with your checkout, your mobile user experience, or your transaction processing?
How does a company know which might drive the biggest improvements?
Where to start?
If you are like us you’ve noticed that a lot of companies in the payments industry talk about optimization, but it isn’t always clear what is behind the marketing language or how it might apply to you. To illustrate with a few examples: Chase Paymentech provides a guide outlining 9 ways to improve Authorization Performance, Stripe speaks about increasing Twilio’s Authorization rate by 10%, while Braintree/PayPal highlights that one of the 3 ways to prevent revenue loss is to classify declines.
It is often very hard to know if the opportunities mentioned in blog posts and articles above really apply to you, so let’s dig into how Pagos can help.
At the end of many customer shopping journeys is a transaction; those transactions represent the intent of a customer to buy your product or service and cement a relationship that ideally will deliver revenue to your business over time. Transactions are where this customer intent and associated order are translated into something the “machines” and “pipes” of the payment industry can understand and act on: to authenticate, authorize, and ultimately move money. The payments industry has built up over the years, from early days where “online” didn’t exist and where money took days to move to now in making amazing experiences like Venmo or Uber possible. Understanding your transactions, within your business’ context, requires the right tools—the right lens—so that you can do what’s best for your company and your customers. That’s why we say it is a data + tools + expertise challenge, because only by combining these three things are you able to truly optimize and manage payments to help your business.
We are so excited to be building better tools and services to help you do what’s best for your business no matter which payment processing partners you use.
Peacock by Pagos makes aggregating, visualizing, and understanding your payment data easier than ever before. We provide a no-code—or low-code for additional flexibility—way to get your data into our platform, and a powerful visualization tool which allows you to see details about your orders, transactions, chargebacks, declines, and more with a few clicks. These are the first steps to identifying the opportunities in your own data to manage your business, establish better partnerships with your payment vendors, and grow your revenue.
There’s no better way to introduce Peacock than to dig into how it can help you identify opportunities or challenges that might be impacting your business. Let’s take three areas that are often discussed by payment processors and go into details about how these may appear in your own data.
First, let’s anchor our discussion in the one metric that every company should be looking at when it comes to payments: approval rate, or authorization rate. This is a simple metric, usually expressed as a percentage, which shows the total count of approved transactions divided by the total number of attempted transactions. We recommend you include all attempted transactions in the denominator of this metric because otherwise you risk missing technical errors that are blocking valid transactions.
Example: If you have 10 total transactions attempted, and 8 of those transactions are successful then your approval rate would be 80%. This means that two of those transactions represented customers who tried to buy but got turned away. Are you sure that was for all the right reasons, or could some of them have been successful if you had a different set up?
In Peacock, you can immediately see your overall approval rate along with a few other stats. It’ll look something like this:
Looking at the approval rate of your entire business over time is a great way to get a sense that everything is going well, but it is really hard to get a sense of whether there are addressable challenges or opportunities. Most payment processors in the market today will give you their view of how you are performing based on what they see of your business, and while they do include details on why transactions get declined, the details are usually locked away in the underlying data. This amounts to a lot of additional work for you to make sense of those details and drive your payments strategy. Peacock can help surface this information quickly and easily so you can identify opportunities and challenges. We’ll dig into examples of three good questions to ask of your data.
Which card types are not performing well?
Taking a line from the Chase article above, let’s break the approval rate up by card type: Chase notes “Identify the specific card types that negatively impact authorization rates.” Peacock makes finding this really easy: click on Reports in the top navigation and then click on Card Types to see your approval rate trends by card type. You’ll immediately see your payments data broken down by the major card networks (e.g. Visa, MasterCard, Amex, Discover, etc.) and payment types (e.g. credit card, debit card, prepaid card, etc.), including a view on the approval rates for different card types and their share of the volume. It will look something like:
In this example you can see that while you are achieving 90% overall approval rate, there is a big difference between the credit and debit cards. These types of differences are worth digging into and focusing attention on:
Why is debit not performing as well as credit?
Are they being processed or being used differently?
What type of declines am I seeing?
Going deeper, let’s take a look at what Stripe said in their customer story about Twilio. Stripe mentioned they enabled Account Updater for Twilio and saw a 1.5% improvement in the Approval Rate. Is this an opportunity for you? The first step in figuring this out is breaking down your declines by the detailed reason codes. Identifying transactions that are failing due to expired cards will usually require work since most payment providers don’t provide this as a default view in their dashboards. With Peacock this is easy. Click on Reports > Decline Analysis and you’ll be able to view a breakdown of the reasons why your transactions were declined and where they are occurring. Here’s an example of how Peacock breaks out the overall distribution of your decline codes:
Some declines like expired_cards or lost_stolen and even do_not_honor can be indicators of opportunities for improvements in your payments workflow. Expired card declines are usually what we would consider an addressable decline. Why? When you see a decline due to insufficient funds, it is clear that the consumer may not be able to pay at this time. On the other hand, expired cards are NOT reflecting the consumers’ ability to pay, but rather a technicality related to their card: the details provided in the transaction are not up to date, and there are ways to address this. If you have the opportunity, you can ask for updated information from the consumer. Or if your business is trying to minimize all customer friction, you can consider using payment network tools like Account Updater to get new card details from issuing banks without involving the customer. Almost all networks provide Account Updater functionality. In many cases, using Account Updater can mitigate anywhere from 10% - 50% of total declines due to expired cards. What would this mean to you?
Where are my customers located?
Another really great lens to look at your approval rate data through is by your customers’ location. Braintree’s blog post about addressing the leading reasons for lost revenue correctly points out a key question “Are your customers based in the U.S.?” As we describe in our documentation, payment networks make it really easy for banks anywhere in the world to process payments, but each region has different rules and different approaches. Breaking your approval rate down by issuer country is a great way to explore the impact of customer locations on your approval rates, irrespective of what currencies you may be selling in. It can also give you guidance on how you may want to modify your customer experience: offering a new local currency, changing the information on the checkout page to be localized or tailored to the payment norms of the market, and—in some cases—changing the payment methods you offer. We’ve built a dashboard for this: click on Reports > Issuers and you’ll see details around the performance of payments in various markets.
As a general rule, the buyers that are closest to you will probably perform the best. Is this true in your data today? If not, this could be an area to research with your development team or payment processor.
In the coming weeks, we’ll share more about our products, vision, and how to use our tools to improve awareness of what’s happening in your payment environment. Pagos will make it easy for you to get the visibility and advice you need to optimize your payments performance.
No-code beta integration is now open to businesses using Braintree or Stripe, and our API is available for use with other processors. Register to join.
We also love hearing about optimization challenges; they help us understand what solutions are most valuable. Contact us and share your story!
Share this Blog Post
Share this Blog Post
Latest Blog Posts
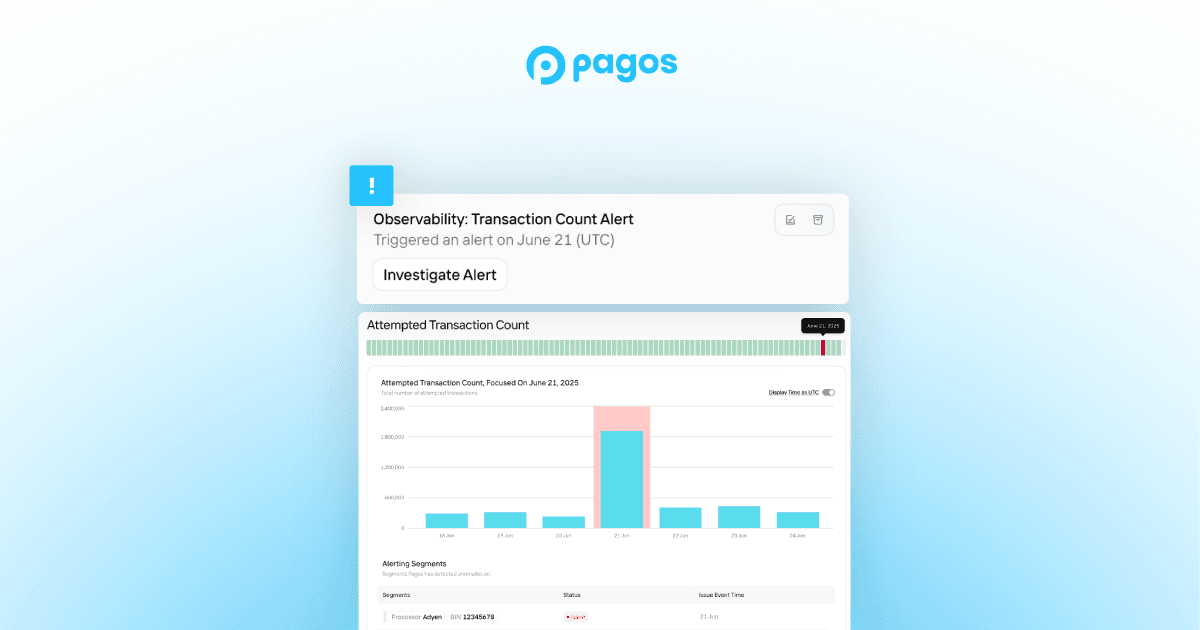
Catching Spikes Before They Burn You: Monitoring BINs to Stay Ahead of Carding Attacks
Catching Spikes Before They Burn You: Monitoring BINs to Stay Ahead of Carding Attacks
Catching Spikes Before They Burn You: Monitoring BINs to Stay Ahead of Carding Attacks

Boosting Pagos’ Engineering Capacity with AI
Boosting Pagos’ Engineering Capacity with AI
Boosting Pagos’ Engineering Capacity with AI
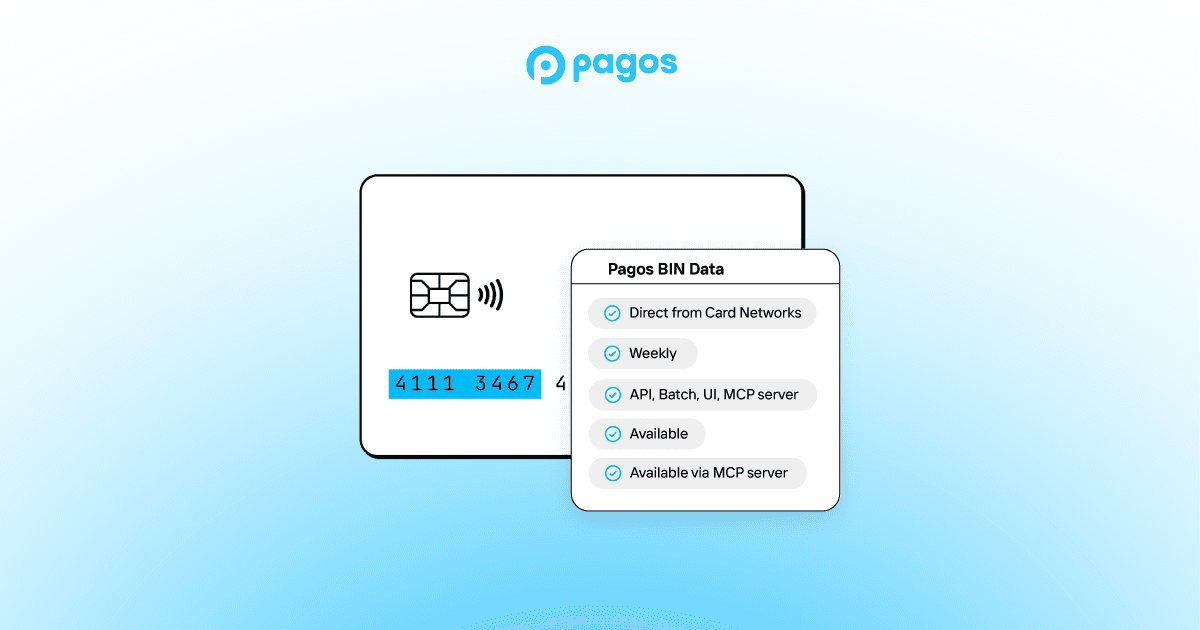
Pagos BIN Data: The Superior Choice for Smarter Payments
Pagos BIN Data: The Superior Choice for Smarter Payments
Pagos BIN Data: The Superior Choice for Smarter Payments
Subscribe to our Blog
Subscribe to
our Blog
Subscribe to our Blog
By submitting, you are providing your consent for future communication in accordance with the Pagos Privacy Policy.