

Parrot
Analyzing Decline Rates by Card Issuing Country with Parrot by Pagos and Google Sheets
August 10, 2021
August 10, 2021

Albert Drouart
Albert Drouart
Albert Drouart
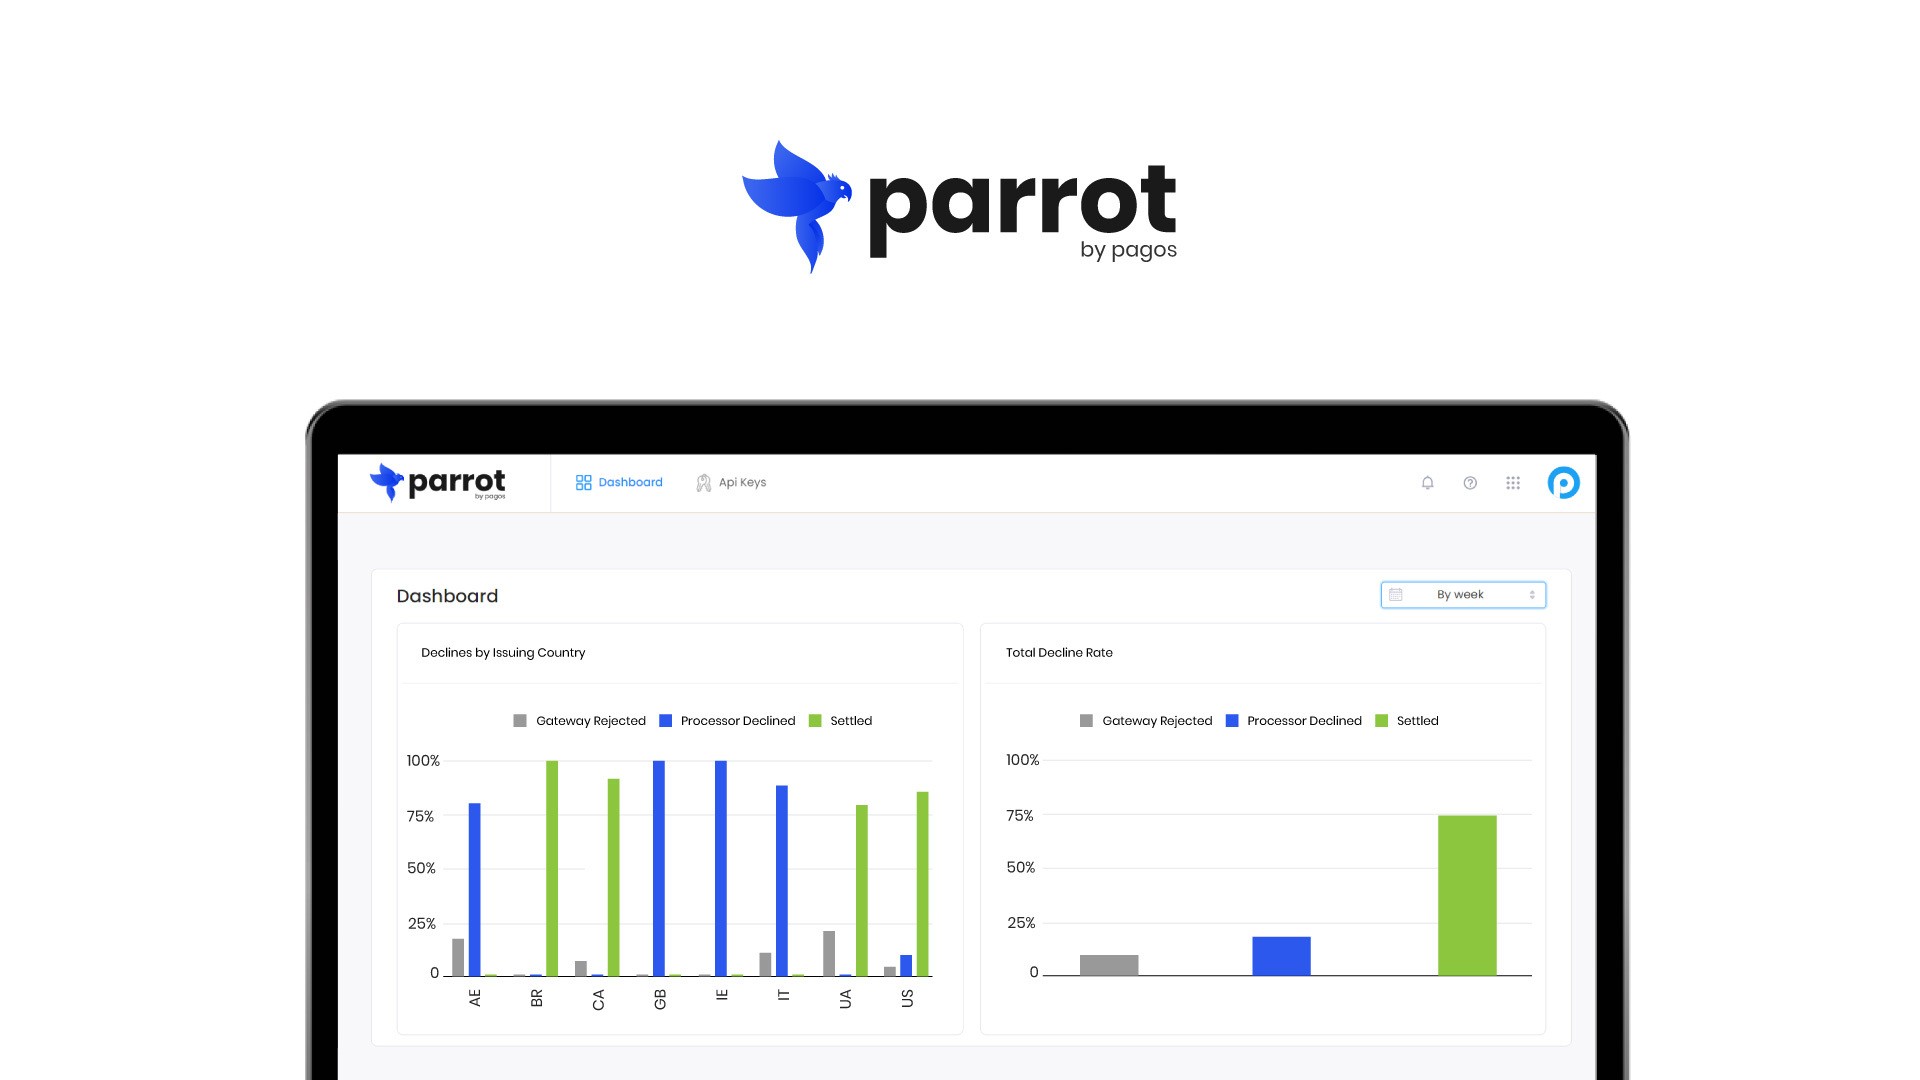
We’ve introduced you to Parrot by Pagos and talked about the future of bank identification numbers (BINs). Now let’s dig into an application of this tool and knowledge on a topic relevant to any business accepting payment cards: declines.
BIN data tells us the type of card being used, where it was issued, and more. All of that information is factored into the decisions issuers make to approve or decline a transaction, and the more detail we have, the better we understand our business and our customers’ experiences. One simple way to gain a better understanding of your transaction data is to analyze decline rates by some additional factor. In our case, we’ll be looking at declines by card issuing country.
Setup
You can integrate Parrot with Google Sheets quickly with a bit of copy and pasting if you want to follow along.

Add transaction status and BIN information from your own payment processor’s reporting to columns A and B and then copy this script and details to cell C2 to replicate this data format. Header names for columns A through G:
Transaction Status
BIN
Network
Card Type
Product ID
Bank Name
Card Country
If you want to change what data is returned, check out the model in our API docs to format your custom query or contact us for help.
Here’s an example of the initial output:

Don’t know what to make of the Product ID? Check out our product code guide.
Add Transaction Data
Pull a report on declined transactions from your payments provider and copy/paste the BIN values into the first column of the sheet. Then, double-click on the bottom right corner of cell B2 to apply the script to each line of BIN data automatically.
Now, it’s time for analysis! Check out Google’s guide to creating and using pivot tables in advance if you’re not familiar with them.
Create a Pivot Table
A pivot table’s a great way to assess a collection of data for patterns. In this example case, we’re looking for trends in declines overall and then by issuer country. If we find something notable, we now have data to inform an inquiry to our payments provider and determine whether there’s something wrong with our configuration or if there are practices we should be following to reduce decline rates.
Total Decline Rate
First up, let’s look at the total decline rate. You can do this by adding the Transaction Status value as a row and then setting Transaction Status as a value. Summarize by COUNTA and then have it show as a percentage of the grand total to view your results.
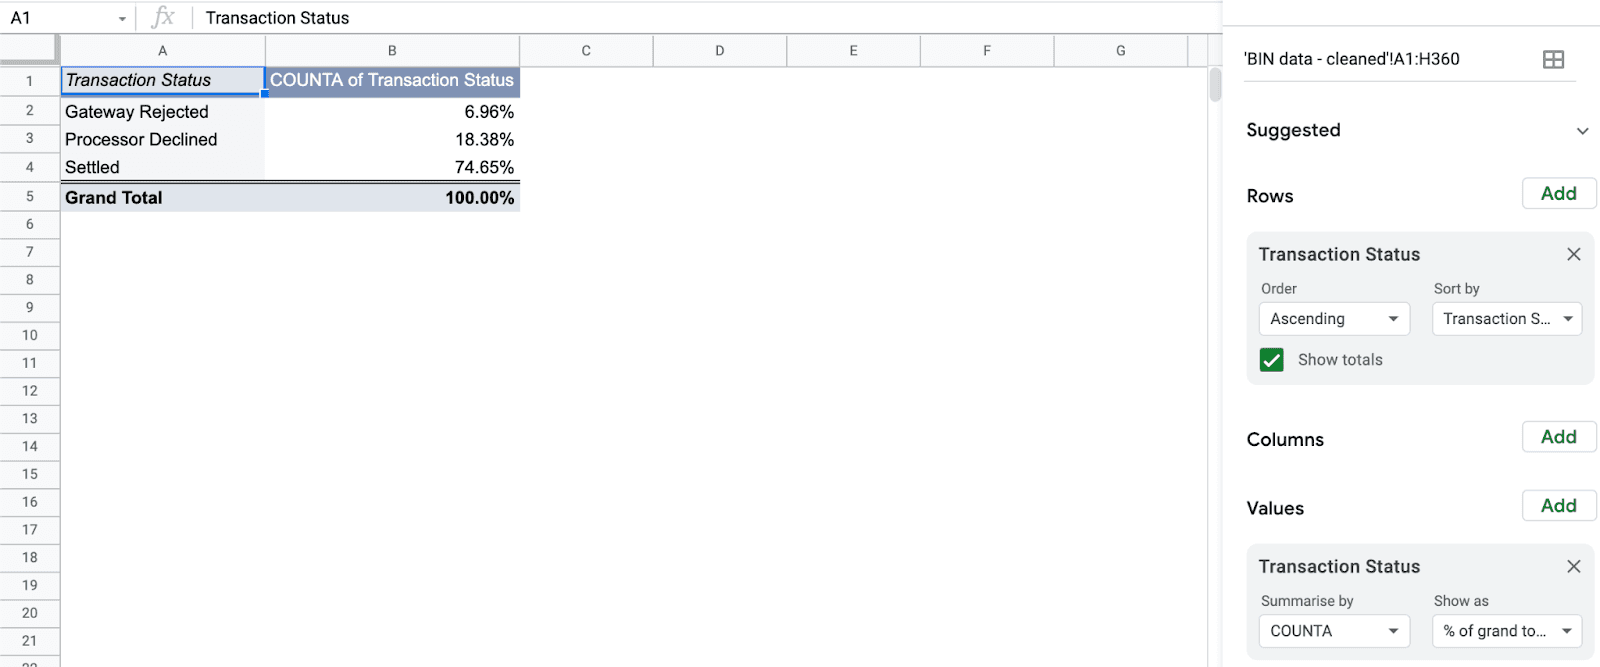
What we know from this is that we have about a 75% transaction approval rate with 18% declines and 7% getting rejected by the gateway based on rules we’ve established. Reasons for gateway rejections include duplicate transaction settings, Address Verification System (AVS), and Card Verification Value (CVV) response requirements.
Declines by Card Issuer Country
To better understand how declines are distributed, we’ll set another pivot table up to list the Card Country values as rows and Transaction Status as columns. Then, set the Transaction Status as the Value to measure on by percentage of row. This allows us to assess the distribution of gateway rejections, processor declines, and approvals submitted for settlement by the country of issuance.
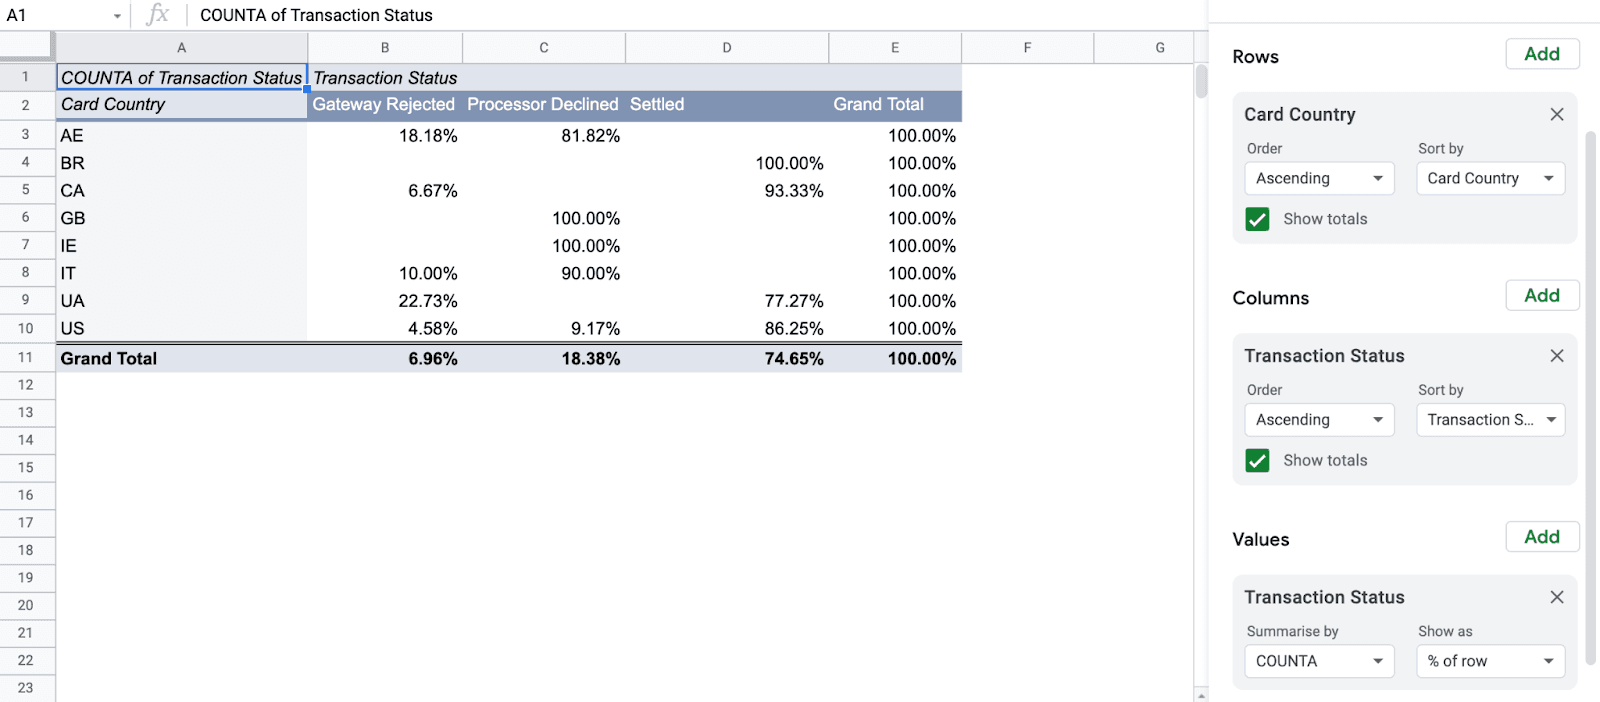
In our transaction data set, we see that transactions from Great Britain (GB) and Ireland (IE) are being declined 100% of the time, and Italy (IT) and United Arab Emirates (AE) have also had no successful transactions. This indicates a problem worth investigating further.
Taking Action
Next steps with the processor of our data would be to reach out to their support team to determine what the cause of such a high decline rate for certain countries might be. It could be a matter of an account configuration error, a gateway setting that’s causing false rejections, or something else.
If you have more than one payment processor, doing an analysis like this for transactions run through each allows you to assess patterns in declines. In some cases high declines may be more common overall, but if you find that you’re experiencing high declines in Great Britain on only one of your processors, it’s worth checking in with them to see if there’s something in your account that needs attention.
Whatever the case, the data Parrot provides helps you better understand your payments environment so improvements which benefit your business and your customers’ experiences can be made. That’s what we’re here to do.
We’ve introduced you to Parrot by Pagos and talked about the future of bank identification numbers (BINs). Now let’s dig into an application of this tool and knowledge on a topic relevant to any business accepting payment cards: declines.
BIN data tells us the type of card being used, where it was issued, and more. All of that information is factored into the decisions issuers make to approve or decline a transaction, and the more detail we have, the better we understand our business and our customers’ experiences. One simple way to gain a better understanding of your transaction data is to analyze decline rates by some additional factor. In our case, we’ll be looking at declines by card issuing country.
Setup
You can integrate Parrot with Google Sheets quickly with a bit of copy and pasting if you want to follow along.
Add transaction status and BIN information from your own payment processor’s reporting to columns A and B and then copy this script and details to cell C2 to replicate this data format. Header names for columns A through G:
Transaction Status
BIN
Network
Card Type
Product ID
Bank Name
Card Country
If you want to change what data is returned, check out the model in our API docs to format your custom query or contact us for help.
Here’s an example of the initial output:
Don’t know what to make of the Product ID? Check out our product code guide.
Add Transaction Data
Pull a report on declined transactions from your payments provider and copy/paste the BIN values into the first column of the sheet. Then, double-click on the bottom right corner of cell B2 to apply the script to each line of BIN data automatically.
Now, it’s time for analysis! Check out Google’s guide to creating and using pivot tables in advance if you’re not familiar with them.
Create a Pivot Table
A pivot table’s a great way to assess a collection of data for patterns. In this example case, we’re looking for trends in declines overall and then by issuer country. If we find something notable, we now have data to inform an inquiry to our payments provider and determine whether there’s something wrong with our configuration or if there are practices we should be following to reduce decline rates.
Total Decline Rate
First up, let’s look at the total decline rate. You can do this by adding the Transaction Status value as a row and then setting Transaction Status as a value. Summarize by COUNTA and then have it show as a percentage of the grand total to view your results.
What we know from this is that we have about a 75% transaction approval rate with 18% declines and 7% getting rejected by the gateway based on rules we’ve established. Reasons for gateway rejections include duplicate transaction settings, Address Verification System (AVS), and Card Verification Value (CVV) response requirements.
Declines by Card Issuer Country
To better understand how declines are distributed, we’ll set another pivot table up to list the Card Country values as rows and Transaction Status as columns. Then, set the Transaction Status as the Value to measure on by percentage of row. This allows us to assess the distribution of gateway rejections, processor declines, and approvals submitted for settlement by the country of issuance.
In our transaction data set, we see that transactions from Great Britain (GB) and Ireland (IE) are being declined 100% of the time, and Italy (IT) and United Arab Emirates (AE) have also had no successful transactions. This indicates a problem worth investigating further.
Taking Action
Next steps with the processor of our data would be to reach out to their support team to determine what the cause of such a high decline rate for certain countries might be. It could be a matter of an account configuration error, a gateway setting that’s causing false rejections, or something else.
If you have more than one payment processor, doing an analysis like this for transactions run through each allows you to assess patterns in declines. In some cases high declines may be more common overall, but if you find that you’re experiencing high declines in Great Britain on only one of your processors, it’s worth checking in with them to see if there’s something in your account that needs attention.
Whatever the case, the data Parrot provides helps you better understand your payments environment so improvements which benefit your business and your customers’ experiences can be made. That’s what we’re here to do.
Share this Blog Post
Share this Blog Post
Latest Blog Posts
Catching Spikes Before They Burn You: Monitoring BINs to Stay Ahead of Carding Attacks
Catching Spikes Before They Burn You: Monitoring BINs to Stay Ahead of Carding Attacks
Catching Spikes Before They Burn You: Monitoring BINs to Stay Ahead of Carding Attacks

Boosting Pagos’ Engineering Capacity with AI
Boosting Pagos’ Engineering Capacity with AI
Boosting Pagos’ Engineering Capacity with AI
Pagos BIN Data: The Superior Choice for Smarter Payments
Pagos BIN Data: The Superior Choice for Smarter Payments
Pagos BIN Data: The Superior Choice for Smarter Payments
Subscribe to our Blog
Subscribe to
our Blog
Subscribe to our Blog
By submitting, you are providing your consent for future communication in accordance with the Pagos Privacy Policy.